


Systematic Credit Trading Summary and Trading Model Indicators
30 June 2025


Report by Larry Domash
Systematic credit trading overview and model indicators
US equities outperformed credit directionally for the second consecutive day on Friday. Significant cash remains on the sidelines for credit, with elevated trading volumes observed, likely due to the upcoming 4th of July holiday and end-of-month/quarter activities. While trading may not slow down early this week, notable deal announcements include SMFG and Softbank (perennial model output long trade issuers) and ABN Amro (frequent “attractive short” trade) issuing 3Y USD Senior Preferred bonds.
Trading Model Insights
Over 65% of annual G-255 new supply comes from “serial issuers,” prioritizing shareholder returns over balance sheet strength. However, in the past three trading days, six G-255 issuers with deleveraging balance sheets or net cash as of March 31 have come to market—an unusual occurrence. The High Yield CDX is within 2 points of its December 2024 two-year high and indicator of the overall risk market “appetite.”
Large-cap single-A rated industrial issuers are among the three most overvalued trading sectors, with ~65% of issuers in this sector adding debt to boost shareholder payouts. Detailed sector balance sheet and operating metrics are provided on pages 5 and 6.
Stochastic Quantitative Credit Trading Model Output
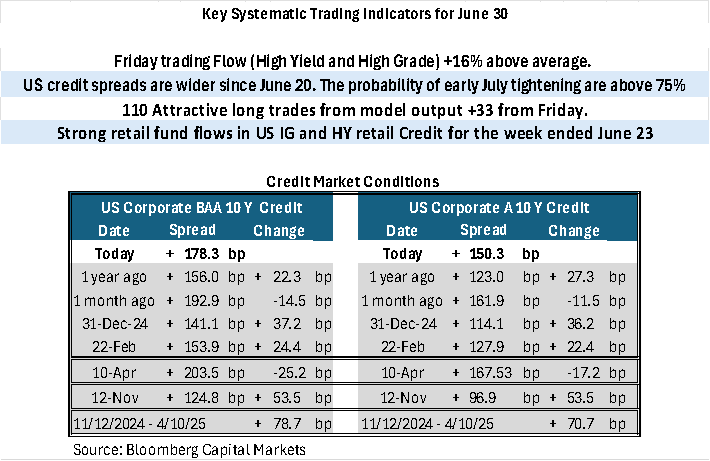
Historical trends and model outputs indicate a 78% probability of US Investment-Grade (IG) credit spreads tightening from July 1-3, with a 28% chance the High Yield CDX reaches 109, just 1 point shy of its all-time high. Strong inflows into the High Yield market continue, suggesting investors are capitalizing on the momentum.
Earnings season begins July 9, with Delta (DAL, Baa2/BBB) providing updates on travel demand to Europe, the Middle East, and the Far East. Key bank earnings from five major US banks are expected two weeks from July 8.
Trading Strategy and Balance Sheet Analysis
Q1 balance sheet analysis of global banks (US Big 6, regional, Canadian, European, French, UK, and single-A/BBB-rated TMT) supports our trading recommendations. Japanese banks show particularly strong balance sheets. Model outputs recommend:
Long Yankee Banks / Short US Money Center Banks
Long single-A TMT / Short single-A Healthcare or Single A rated Industrials.
Of 125 systematic long/short trades (marked to market by TRACE prints), 80% met their +/- 5bp target and achieved ±6.89 basis points per average trade. Sector operating metrics for the new single A industrial trading model sector recommendations are shown on pages 5-6.
Portfolio Trading Model Recommendations
Of over 6,000 bonds tracked, 606 are near 52-week tight or wide spread levels, ~12% above historical averages. The model avoids adding short positions this morning due to strong credit inflows for the week ending June 25. One short trade hit its avoid point on Thursday. The model maintains:
62% long / 18% short strategy
20% front-end allocation, with 67% in floating-rate notes (FRNs) maturing within three years, targeting undervalued, deleveraging bonds
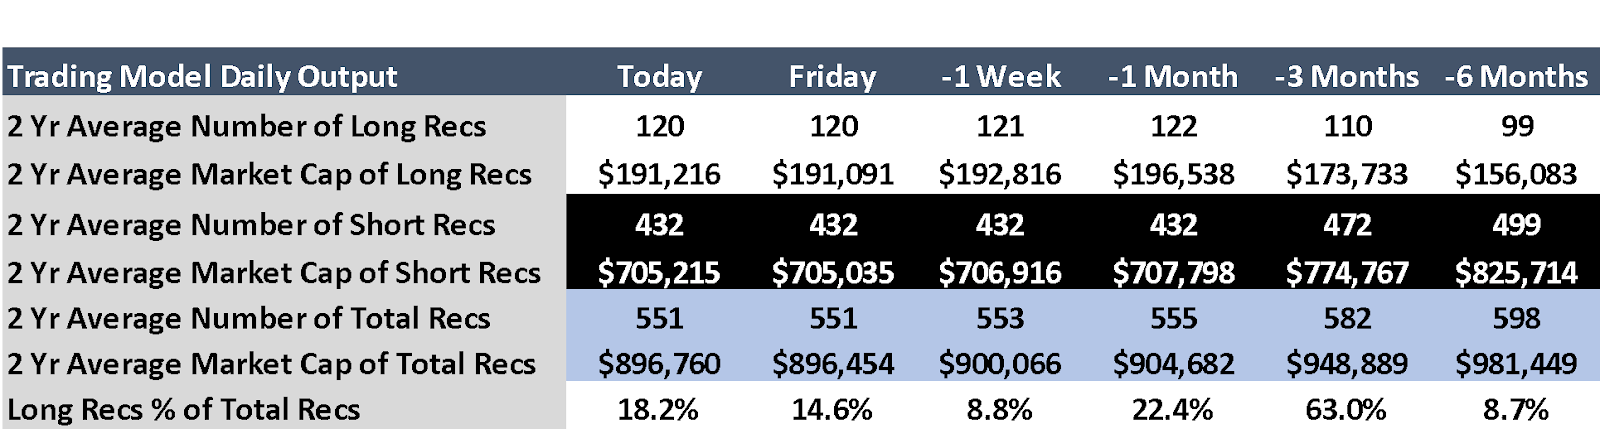
Attractive long trade output is near a 5-week high, slightly below average.
Friday/Monday Key Trading Issues
With the end of the month, quarter, and 4th of July week, trading volumes surged, with apparent “real” end-user buying. LQD saw a fourth day of inflows on Friday, with further details to follow.
Thursday’s U.S. Credit Trading
Investment-Grade (IG) Trading
-Volume: 11% above average
-G-255 Issuers: Represented 93 of the top 100 traded issuer bonds, accounting for 93% of top 100 issuer volume and 71% of total TRACE volume.
High-Yield (HY) Trading
-Volume: 17% above average
-G-255 Issuers: Represented 19 of the top 25 traded bonds, accounting for 71% of top 25 issuer volume and 55% of total TRACE volume.
Market Movement
U.S. CDX Index: Tightened (-0.5 bp) Friday @ 52 bp
U.S. IG Cash Spreads: Ranged from +2 bp wider to -2 bp tighter; financials slightly tighter, industrials and healthcare wider
CDX HY Index: +0.2 pt @ 107.2 (per Bloomberg)
HY Cash Bonds: BB TMT and lower-tier US bank capital structure bonds were top performers
High-Yield Activity
- Dealers bought $600mm of HY bonds on Friday. That is the 9th day in 12 that dealers have bought “Junk” paper.
Most Bought HY Bonds by End Users
- Citigroup Perps (C, Ba1/BB+ attractive lon
Most Sold HY Bonds by End Users
- EchoStar (SATS, Ca1/B attractive short)
- Carnival Corp (CCL Ba3/BB- attractive long).
Investment-Grade Activity
- Dealers net sold $1 billion of IG bonds on Friday.
Most Bought End-User Bonds
- Barclays PLC (BACR, Baa1/BBB+ attractive long) new issue.
- JBS (JBS Baa3/BBB-)
Most Sold Issuer Bonds
- Disney (A2/A, attractive long)
Inflation, Economic Data, and Interest Rates
Personal consumption expenditures fell 0.3% in May after adjusting for inflation, according to Bureau of Economic Analysis
University of Michigan June Consumer sentiment index rose to 60.7 from 52.2 in May. 1Y inflation expectations fell 5.0% from 5.1% in May.
Attractive Trading Sectors
Long Opportunities
Single A TMT $72.8 billion. 41 bonds are considered undervalued by the stochastic credit trading model with 12 attractive long trade recommendations.
Short Opportunities
U.S. Big 6 Banks (All Ratings): $709 billion in overvalued market capital across 280 bonds, with 105 short recommendations.
Single A and BBB Industrials $139.4 billion in overvalued market capital across 110 bonds, with 38 short recommendations.
Issuer News
None worth reading about
U.S. IG Credit Valuation and Spreads

Spread Recovery: U.S. credit spreads have recovered 45% of the widening observed from November 12, 2024, to April 10, 2025. However, US credit spreads are now wider over the past 7 trading days.
Valuation: U.S. credit is currently fairly valued.
Global Equity Correlation to IG Credit Spreads
For the second consecutive day and the 7th time in 44 trading days, US corporate credit did not track US equity price movements on Friday. Historically, US credit and equity prices have moved directionally together on just under 85% of trading days.
New Supply, Bond Maturities, and Credit Fund Inflows for June
Last week, $21.8 billion in new USD bonds were issued by 10 of the world’s largest borrowers, doubling the EUR supply for the first time in 10 weeks. Month-to-date G-255 supply totals approximately $53 billion, below the June average. Notably, new supply from deleveraging companies or those with net cash, including CaixaBank (Baa2/BBB), Mizuho (A1/A-), Toyota (A1/A+), and Takeda Healthcare (Baa1/BBB), came at attractive prices. These bonds remain the best long trading opportunities according to our credit trading model.
Systematic Trading Model Indicators and Strategy
Model Output
496 attractive short recommendations: 45 more than Friday, marking the highest number of short trades since February 12, 2025.

110 attractive long recommendations: Up 33 from Friday. Credit spread widening (+4 to +7 bp) over the past 9 trading days has brought the number of attractive long trades near the 200-day moving average of 120 deleveraging bonds trading at or near their interim or 52-week wide spread levels.
Weekly Trading Strategy (ending July 3) Model output changes slightly until Thursday’s fund flow data.
Prioritize long positions in deleveraging new issues with attractive valuations.
Add shorts of relevering issuers with the deepest discount from their model avoid point.
Systematic Portfolio Trading Model Recommendation: Add 1 short for each 1 long position
Systematic Credit Long/Short Basket Trade
The trading model uses predefined, back-tested processes driven by issuer data and market parameters, targeting ±5 basis points of spread movement in minimal trading days while minimizing volatility risk. The model employs only publicly available data.
Most Recent Systematic long/short trades
Union Pacific (UNP, A3/A-): UNP 5.60% 12/01/2054 and UNP 5.1% 2/20/35 are two 9 new issue recommendations published before February 23, 2025, that has not reached its avoid trading level.
Barclays (BACR, Baa1/BBB+): BACR 5.785% 2/25/26 is one of 9 new issue recommendations published before February 23, 2025, that has not reached its avoid trading level.
Systematic Long/Short Basket Trade Performance Report (January 4, 2025 – June 25, 2025)
Total Trades: 126 (1% of total recommendations).
Performance Summary:
Long Recommendations: 74/95 reached avoid-trading levels, tightening by -9.72 bp.
Short Recommendations: 27/31 reached avoid-trading levels, widening by +5.49 bp.
Remaining Longs: 21 tightened by -0.67 bp.
Remaining Shorts: 4 tightened by -6.5 bp.
Average Spread Movement: ±6.70 bp in the recommended direction.
Success Rate: 81% of recommendations reached avoid-trading levels (9% below normal).
Average trade holding period: (26 trading days) + 27% above normal
Notes:
Initial long trades based on TRACE print (or new issue price) at recommendation date.
Avoid recommendations based on TRACE print trade at the “avoid point” on the trade date.
Recent Performance (Since May 15, 2025)
21 long trades hit avoid-trading levels, contributing -1.51 bp to overall spread tightening for the 73 long trades.
3 short trades hit avoid trading level (+5.3bp from model recommendation level)
Overall performance improved from ±4.91 bp to ±6.70 bp across 125 systematic long/short trades.
1Q Earnings Review and Model output: Single A Industrials
Overview
There are 18 Aerospace and Defense, Chemical, Mineral, Machinery, and Transport companies globally with at least $15 billion in tradable debt market capitalization and a credit rating of Single A or better.
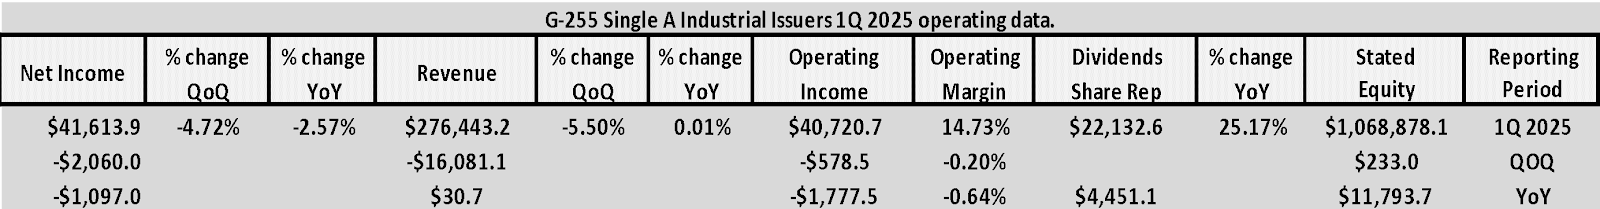
1Q 2025 Performance
First quarter 2025 showed negative year-over-year (YoY) comparisons for revenue and reported earnings, while operating cash flow remained flat. Despite this, all 18 issuers increased dividends and share buybacks by 25% YoY.
Balance Sheet Analysis
The combined balance sheets of Single A rated industrial issuers total $1 trillion in equity. Notably, $650 billion of this equity is held by Berkshire Hathaway (BRK, Aa2/AA). Excluding Berkshire Hathaway, the remaining 17 issuers experienced significant net equity reductions due to asset write-downs and share repurchases.

Berkshire Hathaway maintains approximately $200 billion in net cash. In contrast, the other 17 Single A rated industrial issuers, each with over $15 billion in tradable debt, added nearly $30 billion in net debt during 1Q 2025. These issuers collectively hold approximately $475 billion in total debt and $350 billion in net debt.
Trading Model Output
As of 1Q 2025, the trading model identifies 28 short trade recommendations for Single A rated industrial issuers within this group. Additionally, it flags 78 bonds from the 17 issuers (excluding Berkshire Hathaway), totaling $93 billion, as overvalued.
Disclaimer - This report is not intended as, and does not constitute an offer, or a solicitation to buy or sell any securities or financial instruments. All data, levels, opinions, and representations herein are provided for informational purposes only and should not be relied upon for making investment decisions. Past performance is not indicative of future results. The authors of this report assume no liability for losses or damages arising from the use of this information. Investors should consult with a qualified financial advisor before making any investment decisions. The information in this report is based on sources believed to be reliable, but no guarantee is made as to its accuracy, completeness, or timeliness.