


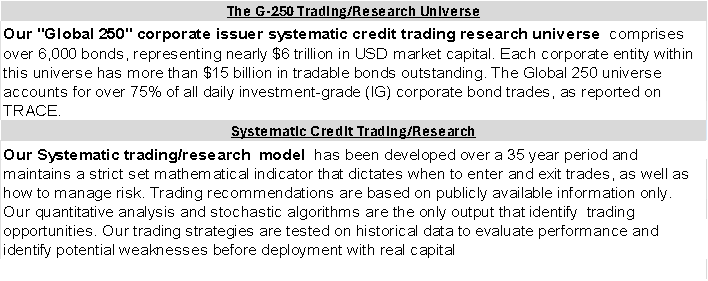
Systematic credit trading overview and model indicators
1 July 2025


By Larry Domash. - please visit Market Signals for more
As June and Q2 2025 concluded, risk assets continued to rally. On Monday, all four G-255 trades priced, though smaller in size. These trades were well-priced, highlighting their significance in the USD credit market, where smaller issues can influence trading dynamics.
With the 4th of July approaching, we are excited to announce a new product long requested by clients: a systematic credit trading model analysis for the iShares iBoxx $ Investment Grade Corporate Bond ETF (LQD).
LQD Systematic Credit Trading Model Analysis
After weeks of infrastructure development, we have successfully run the LQD through our systematic credit trading model. Below is a high-level summary of the model's insights.
Trading Model Insights
Our model covers approximately 65% of LQD's bonds and 86.51% of its holdings value, as shown in the table below:

The LQD is a well-constructed, unhedged, long-only fund with a coupon mixture designed to minimize interest rate risk. Credit risk is concentrated in lower-volatility sectors, with minimal Yankee bond exposure. The fund incorporates features to reduce trading volatility despite daily inflows/outflows and transparent holdings.
Notably, 179 of 230 investment-grade issuers in our model are represented in the LQD, including all top 100 holdings. The variance between LQD holdings and G-255 issuers stems from a significant underweight in Yankee bonds across sectors. Less than 1% of LQD holdings have a market cap below $750 million, with an average holding market cap exceeding $1.4 billion ($3,075,397 total market cap for LQD bonds).
Approximately 54% of bonds reviewed from G-255 issuers are re-levering, aligning with model outputs. However, 58.9% of LQD bonds are classified as either "overvalued" or "undervalued" by the model, creating arbitrage opportunities. Additionally, 16% of LQD bonds trade within 15% of their 52-week high or low spread, offering further trading potential based on daily model outputs and changing holdings.
Sector Insights
Financials: LQD is underweight financials (689 bonds, 28.70% of LQD), with a long position in US Big Six banks and an underweight in Yankee banks, contrasting with our model's current strategy (long Yankee banks, short US money center banks).
Financial Issuer Bonds (Re-Levering): 482 bonds (19.19%)
Financial Issuer Bonds (De-Levering): 207 bonds (9.50%)
TMT: LQD is overweight Single A and BBB-rated Technology, Media, and Telecom (TMT), consistent with model recommendations.
Autos and Utilities: LQD is underweight, aligning with the model.
Industrials and Healthcare: LQD is market-weight in A-rated Industrials and overweight in Single A-rated Healthcare, differing from model recommendations to short these sectors.
Small New Issue Trades
LQD contains almost no new issues with a size below $750 million, explaining the model's tendency to avoid smaller new supply.
Model Updates of LQD trades
We have processed approximately 20,000 credit files for the LQD and will update model recommendations based on the ease of tracking LQD holdings. These trading indicators can be extended to other portfolios, such as the iShares iBoxx $ High Yield Corporate Bond ETF (HYG), upon request.
Weekly model outputs comparing LQD performance will be posted to highlight trading recommendations and portfolio changes. For individual bond indicators within the LQD, please contact us.
We are happy to show individual bonds, issuer trading curves or sector trades / against the LQD upon request.
Stochastic Quantitative Credit Trading Model Output
Monday's credit rally reduced the probability of US Investment-Grade (IG) credit spreads tightening from July 1–3. However, the 28% chance of the High Yield CDX reaching 109 (one point below its all-time high) remains unchanged.
Earnings season begins July 9, with Delta Air Lines (DAL, Baa2/BBB) providing updates on travel demand to Europe, the Middle East, and the Far East. Key earnings from five major US banks are expected two weeks from July 8.
Current Trading Model Indicators - Trading Strategy and Balance Sheet Analysis
Q1 balance sheet analysis of global banks (US Big Six, regional, Canadian, European, French, UK, and Single A/BBB-rated TMT) supports our trading recommendations. Japanese banks exhibit particularly strong balance sheets. Model outputs recommend:
Long: Yankee Banks, Single A TMT
Short: US Money Center Banks, Single A Healthcare, Single A-rated Industrials
Of 126 systematic long/short trades (marked to market by TRACE prints), 80% achieved their ±5 basis point target, averaging ±8.21 basis points per trade. Sector operating metrics for the new Single A industrial trading model recommendations are detailed on pages 5–6 of the full report.
Portfolio Trading Model Recommendations
Of over 6,000 bonds tracked, 601 are near 52-week tight or wide spread levels, approximately 12% above historical averages. The model has paused adding short positions this morning due to strong credit inflows for the week ending June 25. One short trade reached its avoid point on Thursday.
Model Portfolio Trading Indicators:
62% long / 18% short strategy
20% front-end allocation, with 67% in floating-rate notes (FRNs) maturing within three years, targeting undervalued, deleveraging bonds
Attractive long trade output declined Monday owing to significant credit spread movement (tighter).
Friday/Monday Key Trading Issues
With the end of the month, quarter, and 4th of July week, trading volumes surged, with apparent “real” end-user buying. LQD and HYG are seeing significant inflow.
Monday’s U.S. Credit Trading
Investment-Grade (IG) Trading
-Volume: 42% above average
-G-255 Issuers: Represented 96 of the top 100 traded issuer bonds, accounting for 95% of top 100 issuer volume and 75% of total TRACE volume.
High-Yield (HY) Trading
-Volume: 48% above average
-G-255 Issuers: Represented 17 of the top 25 traded bonds, accounting for 66% of top 25 issuer volume and 50% of total TRACE volume.
Market Movement
U.S. CDX Index: Tightened (-1 bp) Monday @ 51 bp
U.S. IG Cash Spreads: Ranged from +1 bp wider to -4 bp tighter; Single A TMT and Autos outperformed.
CDX HY Index: +0.3 pt @ 107.5 (per Bloomberg)
HY Cash Bonds: BB TMT and lower-tier US bank capital structure bonds were top performers. HY healthcare was the worst performing sector.
High-Yield Activity
- Dealers bought $800 million of HY bonds on Monday. That is the 10th day in 12 that dealers have bought “Junk” paper.
Most Bought HY Bonds by End Users
- Citigroup Perps (C, Ba1/BB+ attractive long)
- TransDigm (TDG, B3/B attractive short)
Most Sold HY Bonds by End Users
- EchoStar (SATS, Ca1/B attractive short)
- Carnival Corp (CCL Ba3/BB- attractive long).
Investment-Grade Activity
- Dealers net sold $450 million of IG bonds Monday.
Most Bought End-User Bonds
- ATT (T, Baa2/BBB attractive long)
- JBS (JBS Baa3/BBB-)
Most Sold Issuer Bonds
- Brown & Brown (BRO Baa3/BBB-) new supply
Inflation, Economic Data, and Interest Rates
Dallas Federal Reserve Region:
General business activity index improved to -12.7 in June from -15.3 in May
New order growth worsened to -17.2 from -16.4
Inflation: Prices paid and received accelerated in June
Attractive Trading Sectors
Long Opportunities
None. 219 bonds are considered undervalued by the stochastic credit trading model with 72 attractive long trade indicators for the entire 6,000 bond universe.
Short Opportunities
U.S. Big 6 Banks (All Ratings): $710 billion in overvalued market capital across 280 bonds, with 86 short recommendations.
Single A and BBB Industrials $131.3 billion in overvalued market capital across 102 bonds, with 47 short recommendations.
Issuer News
.
Home Depot (HD, A2/A, attractive short): Acquiring GMS Inc. for $4.3 billion to expand access to professional contractors
Santander (SANTAN, A-/Baa1, attractive short): Submitted a binding offer for Sabadell’s TSB unit, valued at over £2.3 billion; Sabadell may review bids as early as Tuesday
BBVA SA (BBVASM, A3/A, attractive long): Maintains takeover offer for Banco Sabadell SA despite Spanish government’s merger ban a merger for several years.
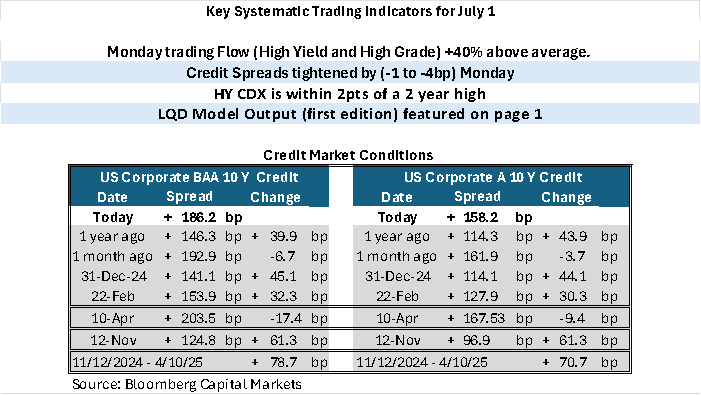
U.S. IG Credit Valuation and Spreads
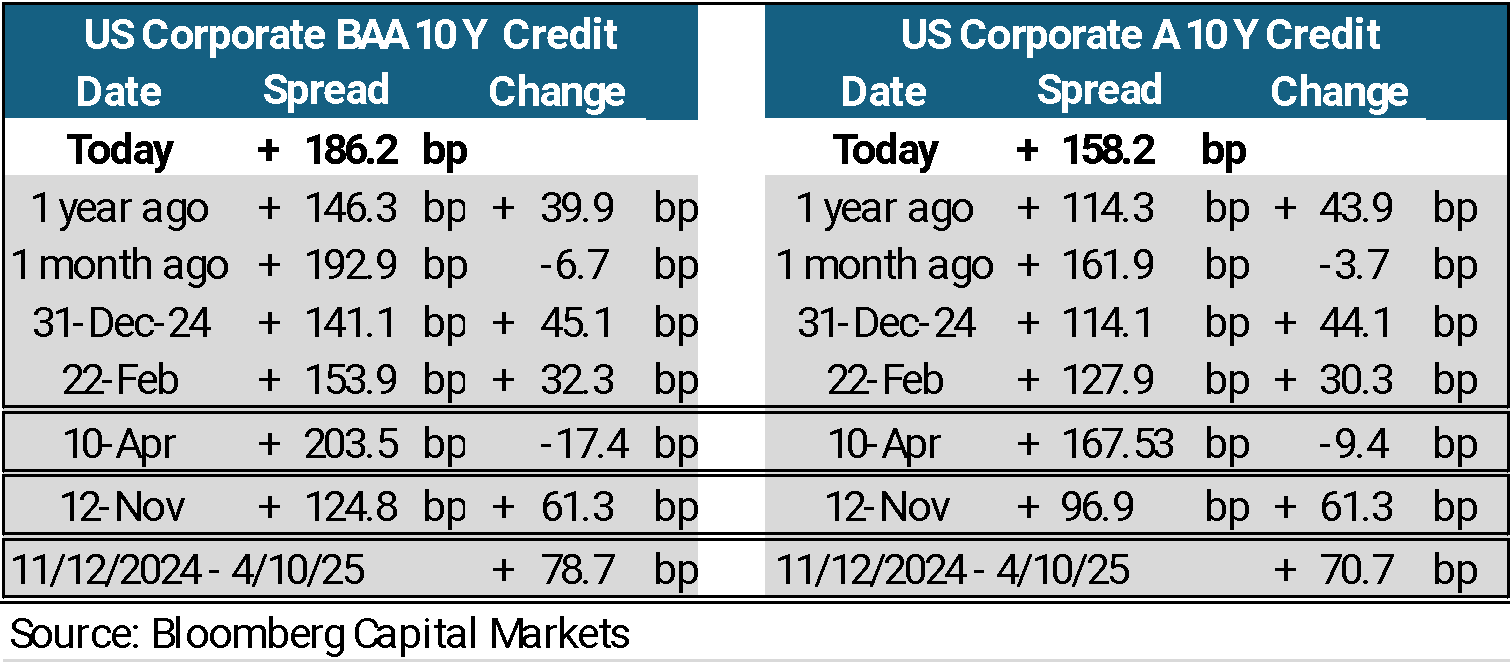
Spread Recovery: U.S. credit spreads have recovered 50% of the widening observed from November 12, 2024, to April 10, 2025. However, US credit spreads are now wider over the past 7 trading days.
Valuation: U.S. credit is remains fairly valued.
Global Equity Correlation to IG Credit Spreads
Equity and Debt valuation returned to historic directional correlation on Monday as end of month and end of quarter trading volumes and flows were strong in both markets. Historically, US credit and equity prices have moved directionally together on just under 85% of trading days.
New Supply, Bond Maturities, and Credit Fund Inflows for June
Monday we saw end of the month transactions from Niagara Mohawk Power Corp (NGGLN, Baa1/BBB+)
$5Y and $30Y Fixed SoftBank Corp (SOBKCO, BBB/BBB+) $5Y and $10Y Fixed. This was Opco Paper – first offering in USD. Issuer is de-levering.

Sumitomo Financial Group (SUMIBK, A1/A-) $6NC5 Fixed, $6NC5 FRN, $8NC7 Fixed $11NC10. Sumitomo Financial Group (SUMIBK, A2/BBB+ ) $ 21NC20 Sub Fixed T2. Issuer has more cash than debt
ABN AMRO Bank NV (ABNANV, Aa3/A) $3Y Fixed Senior Pref and $3Y FRN – Senior Pref issuer is re-levering
Issue size was again small, but $6.25 billion on the $7.75 billion of new supply from the 4 issuers was seen as attractive by our trading model.
Systematic Trading Model Indicators and Strategy
Model Output
527 attractive short recommendations: 31 more than Monday, marking the highest number of short trades since February 12, 2025.
74 attractive long recommendations: 36 fewer than Monday.
Weekly Trading Strategy (ending July 3) Model output changes slightly until Thursday’s fund flow data.
Prioritize long positions in deleveraging new issues with attractive valuations.
Add shorts of relevering issuers with the deepest discount from their model avoid point.
Systematic Portfolio Trading Model Recommendation: Add 1 short for each 1 long position
Systematic Credit Long/Short Basket Trade
The trading model uses predefined, back-tested processes driven by issuer data and market parameters, targeting ±5 basis points of spread movement in minimal trading days while minimizing volatility risk. The model employs only publicly available data.
Most Recent Systematic long/short trades
Union Pacific (UNP, A3/A-): UNP 5.60% 12/01/2054 and UNP 5.1% 2/20/35 are two 9 new issue recommendations published before February 23, 2025, that has not reached its avoid trading level.
Barclays (BACR, Baa1/BBB+): BACR 5.785% 2/25/26 is one of 9 new issue recommendations published before February 23, 2025, that has not reached its avoid trading level.
Excelon Corp* EXC (Baa3/BBB EXC 6 1/2 03/15/55) a pre February 22 new issue recommendation hit its avoid trading level on Monday
Apple, Aaa/AA+) AAPL 4 1/2 05/12/32 reached its avoid trading level on Monday.
Credit Agricole (A3/A-) ACAFP 5.222 05/27/31 reached its avoid trading level on Monday.
This morning we publish the Sumitomo Financial (SUMIBK A1/A-) FRN 7/8/31 as a new long trading indicator.
Systematic Long/Short Basket Trade Performance Report (January 4, 2025 – June 25, 2025)
Total Trades: 126 (1% of total recommendations).
Performance Summary:
Long Recommendations: 74/95 reached avoid-trading levels, tightening by -9.72 bp.
Short Recommendations: 27/31 reached avoid-trading levels, widening by +5.49 bp.
Remaining Longs: 21 tightened by -2.60 bp.
Remaining Shorts: 4 tightened by -9.25 bp.
Average Spread Movement: ±8.21
bp in the recommended direction.
Success Rate: 81% of recommendations reached avoid-trading levels (9% below normal).
Average trade holding period: (26 trading days) + 27% above normal
Notes:
Initial long trades based on TRACE print (or new issue price) at recommendation date.
Avoid recommendations based on TRACE print trade at the “avoid point” on the trade date.
Recent Performance (Since May 15, 2025)
21 long trades hit avoid-trading levels, contributing -1.51 bp to overall spread tightening for the 73 long trades.
3 short trades hit avoid trading level (+5.3bp from model recommendation level)
Overall performance improved from ±4.91 bp to ±8.21 bp across 126 systematic long/short trades.
Disclaimer - This report is not intended as, and does not constitute an offer, or a solicitation to buy or sell any securities or financial instruments. All data, levels, opinions, and representations herein are provided for informational purposes only and should not be relied upon for making investment decisions. Past performance is not indicative of future results. The authors of this report assume no liability for losses or damages arising from the use of this information. Investors should consult with a qualified financial advisor before making any investment decisions. The information in this report is based on sources believed to be reliable, but no guarantee is made as to its accuracy, completeness, or timeliness.