


Systematic credit trading overview and model indicators
11 July 2025 - NOT recommendations


By Larry Domash - the model outputs are available for curves, sectors and the LQD. Please contact gareth.moody@empirasign.com for details. Thank you
Disclaimer - This report is not intended as, and does not constitute an offer, or a solicitation to buy or sell any securities or financial instruments. All data, levels, opinions, and representations herein are provided for informational purposes only and should not be relied upon for making investment decisions. Past performance is not indicative of future results. The authors of this report assume no liability for losses or damages arising from the use of this information. Investors should consult with a qualified financial advisor before making any investment decisions. The information in this report is based on sources believed to be reliable, but no guarantee is made as to its accuracy, completeness, or timeliness.
Delta Air Lines Inc. (DAL)
Bloomberg reported that Delta Air Lines reinstated a profit outlook for 2025, signaling a traveler rebound and boosting its stock amid renewed confidence in the US consumer. However, this narrative overstates Delta’s actual 2Q performance. Operating earnings and main cabin pricing fell significantly year-over-year. Despite this, Delta, the world’s leading airline, continues to strengthen its balance sheet. The reported optimism about the US consumer was not strongly supported by Delta’s 2Q report.
Significant New Issues in US Credit Markets
Over the past two days, two major US credit market issuances stood out, the largest in three months:
NTT USD Bond Issuance
The NTT deal, a Single A TMT issuance, was a “blowout” due to its attractive pricing. TMT remains the most bought sector in US credit markets in 2025. Post-deal, NTT will surpass five of the current 12 G-255 Single A TMT issuers in sector prominence.
Nissan (NSANY, Ba2/BB)
Nissan priced $4.5 billion in 5Y, 7Y, and 10Y high-yield debt at highly attractive levels, despite challenges: weak unit volume sales, earnings warnings from Daimler Truck (DTRGR, A3/A- attractive short) and Volkswagen (VW, A1/BBB+ attractive short), a -9% drop in Nissan’s equity (7201 JT) tied to its ¥750 billion convertible bond offering on Monday, and US high-yield market outflows. This deal marks the most attractive pricing in IG or HY markets in 2025.
Quantitative and Credit Trading Model Update
High-yield funds saw outflows, while investment-grade funds recorded a seventh consecutive week of inflows. This shifted our model’s allocation to G-255 long credit to 57.5% (down from 62.5%) for the week ending July 17. Despite outflows, the model views the NSANY deal as attractive.
Upcoming Earnings
Next week, 29 major US corporate debt issuers will report, 25 of which are among the 255 largest global corporate borrowers. Of these, 21 are financial issuers, and 14 of the 25 G-255 issuers were reducing net balance sheet debt as of Q1 2025.
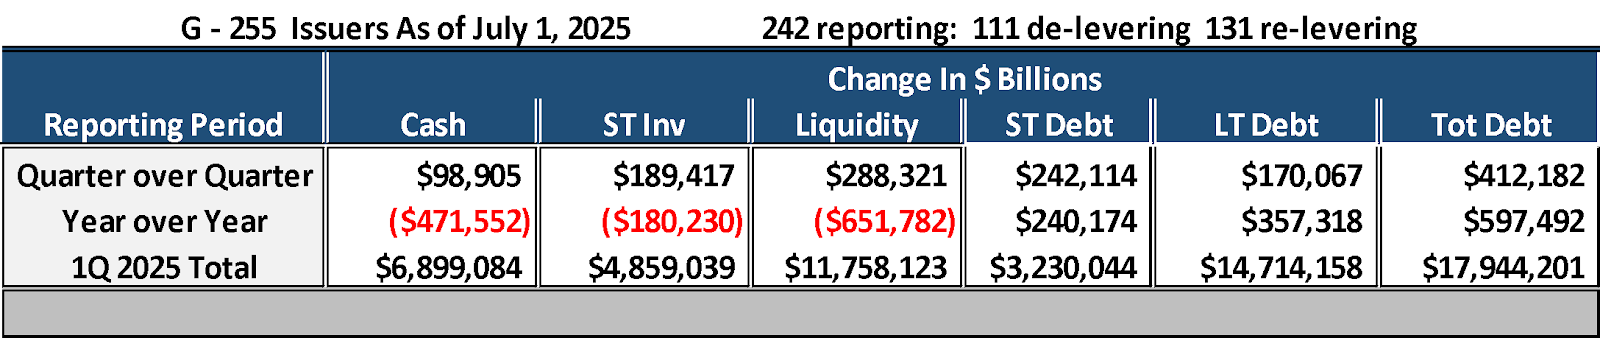
Q1 2025 Corporate Balance Sheet Overview
Among the 242 corporate balance sheets reporting in Q1 2025:
Global totals show $11.76 billion in liquidity against $17.9 billion in debt.
Excluding 41 non-US financial institutions (with $7.5 billion in liquidity and debt), 85 issuers were deleveraging, 117 were releveraging, with $4.2 billion in liquidity against $10.4 billion in debt across 102 US financial and global non-financial balance sheets.
These 102 issuers added nearly $400 billion in net debt in Q1 2025.
An additional $500 billion in net debt on these balance sheets could slow the share repurchase and dividend growth rate for global equities.
Inflation, Economic Data, and Interest Rates
Rail carloads for the week ending July 5 were 204,513 carloads, +4.8% compared with the same week in 2024.
U.S. weekly intermodal volume was 238,536 containers and trailers, up 5.2% compared to 2024.
Weekly Jobless Claims:
Initial Jobless claims for the week ended July 4, 2025 rose 5,000 when compared with same week in 2024 to 227k.
Continuing claims for the week ended June 26 rose 109k to 1.965mm when compared to the same week in 2024.
The US Treasury's 30-year auction hit a high yield of 4.889% on Thursday, up from the 4.844% high in the previous auction.
The bid-to-cover ratio for the auction was 2.38, below the 2.43 ratio in the May 8 auction.
Dealers represented 55.3% of the bids, with direct bidders at 15.5% and indirect bidders at 29.3%.
Allocation was dealers - 12.8%, with direct bidders at 27.4% and indirect bidders at 59.8%.
The UST curve was unchanged on Thursday.
Systematic Trading Model Insights and Trading Strategy (July 11, 2025)
The Systematic Trading Model analyzes data for over 6,000 bonds, with 663 currently within 20% of their 52-week tight or wide spread levels (19% above historical averages). Over the past 3 days, there has been a significant reduction in bonds trading near 52-week tight spreads in sectors identified as overvalued by the model.
Current Trading Allocation Strategy
-57% long
-23% short
-20% front-end allocation (75% in floating-rate notes maturing within 3 years, targeting undervalued, de-levering bonds).
Performance: Of 130 long/short trades (marked to market via TRACE) in 2025, 90% achieved ±5 bp targets, averaging ±7.40 bp per trade.
Recent Activity:
-The model paused adding short positions on July 2, 2025, due to the number of non – replaced long trading positions over the last week of June – first week of July
-Between June 30 and July 8, 2025, 10 long trade indicators reached “avoid” levels, prompting a shift to a “more short” stance in the long/short basket.
-Thursday’s trading allocation adjustment is the first in 3 weeks, driven by recent credit fund outflows.
Sector Trading Recommendations for Thursday
Long:
-Yankee Banks (particularly floating-rate notes).
-Single A TMT.
Short:
-U.S. Big 6 Money Center Banks.
-Single A Healthcare.
-Single A and BBB Industrials (re-levering, with tight spreads).
-BBB TMT with larger issuer tech firms re-levering.
Risk Management: The model avoids adding risk to G-255 issuers scheduled to report results within 30 days, in compliance with global regulatory requirements for reporting “material events” within 30 days of a scheduled earnings release.
Thursday’s U.S. Credit Trading
Investment-Grade (IG) Trading
-Volume: 11% above average
-G-255 Issuers: 97 of the top 100 traded issuer bonds, accounting for 97% of top 100 issuer volume and 75% of total TRACE volume.
High-Yield (HY) Trading
-Volume: +7% above average
-G-255 Issuers: 14 of the top 25 traded bonds, accounting for 57% of top 25 issuer volume and 47% of total TRACE volume.
Market Movement
U.S. CDX Index: -1bp tigher Thursday @ 50 bp
U.S. IG Cash Spreads: Were -2bp tighter to +2bp wider; US financials outperformed while Single A and BBB Telecom and Global Autos underperformed.
CDX HY Index: rose +.1 pt @ 107.80 (per Bloomberg)
HY Cash Bonds: BB Consumer and Material bonds were top performers. There were no sectors that traded lower.
High-Yield Activity
- Dealers bought $1.3 Billion of HY bonds Thursday.
Most Bought HY Bonds by End Users
- Nissan Motor Corp (NSANY Ba2/BB attractive long)
Most Sold HY Bonds by End Users
- Transdigm (TDG Ba3/BB- attractive short)
Investment-Grade Activity
- Dealers net sold $400 million of IG bonds Thursday.
Most Sold End User Sectors and Bonds
- IG TMT – even after $500mm of net buys of new NTT – TMT was the most sold IG sector Wed.
NTT new issue (NTT, A3/A- attractive short
JPM Chase (JPM A1/A attractive short)
Most Sold Bought Issuer Sector: Big 6 banks
- Wells Fargo (WFC, A2/BBB+ attractive short) was the most bought issuer.
Attractive Trading Sectors
Long Opportunities
Floating Rate Notes of de-levering issuers (UK bank and Japanese Bank issuance most attractive) Overall model indicators 205 bonds ($298.9 billion) are considered undervalued by the stochastic credit trading model with 84 attractive long trade indicators for the entire 6,000 bond universe.

Short Opportunities
1367 bonds ($1.03 trillion) are considered overvalued by the stochastic credit trading model with 577 attractive short trade indicators for the entire 6,000 bond universe.
U.S. Big 6 Banks (All Ratings): $701 billion in overvalued market capital across 279 bonds, with 82 short recommendations.
BBB TMT $214.5 billion in overvalued market capital across 129 bonds, with 36 short recommendations.
Single A, BBB and Industrials $140 billion in overvalued market capital across 112 bonds, with 47 short recommendations.
Single A Healthcare $174.8 billion in overvalued market capital across 119 bonds, with 49 short recommendations.
Issuer News
Apple Inc (AAPL, Aaa/AAA attractive long)
Apple is set to launch an ambitious array of new products in the first half of 2026, including a budget-friendly iPhone, multiple iPads, and upgraded Macs. The lineup, expected by spring 2026, includes updates to the entry-level iPad, iPad Air, and an external Mac monitor, as per sources familiar with the plans. The new budget smartphone, named the iPhone 17e, will succeed a $599 model introduced earlier this year.
Intesa Sanpaolo SpA (ISPM, Baa1/BBB attractive short)
Intesa Sanpaolo plans to transfer credit risk associated with approximately €13 billion in loans this year through significant risk transfer sales, according to Elisabetta Bernardini, head of balance sheet optimization at Intesa.
Alibaba (BABA, A1/A+ attractive long)
Goldman Sachs estimates that Alibaba could incur a 41 billion yuan loss in its food-delivery business for the 12 months ending June 2026. HSBC analysts note that “aggressive investments in food delivery and instant shopping will significantly impact its near-term earnings outlook.”
U.S. IG Credit Valuation and Spreads

Spread Recovery: U.S. credit spreads have recovered 45% of the widening observed from November 12, 2024, to April 10, 2025.
Valuation: U.S. credit is now slightly overvalued based on output from our credit trading model.
Global Equity Correlation to IG Credit Spreads
On Thursday, U.S. IG credit spreads and U.S. equity prices showed directional correlation for the 52nd time in 59 trading days. Over the past 30 days, IG credit spreads tightened by -7 basis points, while the S&P 500 and Dow Jones Industrial Average each rose by more than +4%. Additionally, June ranks as the second-least active month for G-255 corporate earnings reports, with December having the fewest.
New Supply, Bond Maturities, and Credit Fund Inflows for July
NTT USD Bond Issuance: The seven-part USD NTT bond issuance, priced on Wednesday, was deemed attractive by our trading model despite the issuer's re-leveraging. However, the deal outperformed anyone’s expectations. Notably, the floating rate notes (FRNs) traded exceptionally well. This Single A TMT USD deal, the most net-bought sector in 2025, saw spreads tighten significantly (-10bp for longer-dated issues and -20bp for FRNs).
Nissan (NSANY Ba2/BB) Issuance
Thursday’s delayed Nissan high-yield (HY) bond issuance followed negative auto sector headlines and a -9% drop in Nissan’s 7201 equity price on Monday. Despite Nissan’s deleveraging efforts and HY fund outflows, our systematic credit trading model identifies the NSANY deal as the only attractive HY deal, with the 5-year tranche being the most compelling.

Retail Bond Fund Flows (LSEG Lipper)
Flows for the week ended July 9, compared to the week ended July 2:
Short and intermediate investment-grade bonds: $1.77 billion inflow vs. $4.03 billion inflow
High-yield notes: $304.1 million outflow vs. $808.4 million inflow
Treasuries: $775.7 million inflow vs. $3.48 billion outflow
June’s inflow: $2.3 billion, the lowest this year
US leveraged loans: $565 million inflow vs. $872.2 million inflow
Mortgage-related: $661.7 million inflow vs. $59.6 million outflow
ETF Bond Fund Flows (Bloomberg, Wednesday)
Corporate bond ETFs: Shifted from $4.45 billion in inflows to $801.9 million in outflows
Investment-grade (IG) ETFs: Fell from $2.21 billion to $1.33 billion
High-yield ETFs: Dropped from $1.09 billion to $46.8 million
Year-to-date net inflows: Reached $184 billion
Overall, Investment-grade bond funds saw inflows for the seventh consecutive week, while high-yield funds experienced outflows.
Systematic Trading Model Indicators and Strategy
Model Output
Attractive short recommendations decreased to 577, down 9 from Thursday and 221 from Tuesday. The majority of the decline stems from sectors flagged as overvalued by the trading model over the past month.

86 attractive long recommendations: 7 more than Thursday.
Systematic Portfolio Trading Model Recommendation:
Prioritize Long Positions: Focus on deleveraging new issues with attractive valuations. Ideal maturity for long positions is approximately 7 years.
Short Positions: Target re-levering issuers trading at the deepest discount from their model avoid point. Avoid short positions with maturities around 7 years, as they are the least attractive.
Replace Longs: Replace systematic attractive long positions that have reached their avoid trading level.
Portfolio Trading Hurdle: Once the portfolio reaches a 75% long hurdle, maintain a 1:1 long-to-short ratio for additional positions.
Current Status of trading indicators below:
-Long positions have declined by 8 since last Wednesday.
-10 long trades have reached their avoid trading levels and require replacement.
-A Nissan new issue long trading recommendation has been published.
Systematic Credit Trading Strategy July 11, 2025
Closed Positions: Exited the 10 long trades that have reached their avoid trading levels.
Enter New Longs:
Implement the Nissan (NSANY) long position as per the published recommendation.
Identify and add 9 additional long positions in deleveraging new issues with attractive valuations and maturities around 7 years.
Monitor Portfolio Composition:
Track the percentage of long positions relative to the total portfolio.
If replacing the 10 long positions pushes the portfolio above the 75% long hurdle, initiate short positions in re-levering issuers (avoiding 7-year maturities) at a 1:1 ratio for any additional long positions.
Review: Reassess portfolio balance after next Thursday’s fund flow data to ensure alignment with the systematic model.
Systematic Credit Long/Short Basket Trade
The trading model uses predefined, back-tested processes driven by issuer data and market parameters, targeting ±5 basis points of spread movement in minimal trading days while minimizing volatility risk. The model employs only publicly available data.
Current Sample Systematic individual bond trades based on trading strategy
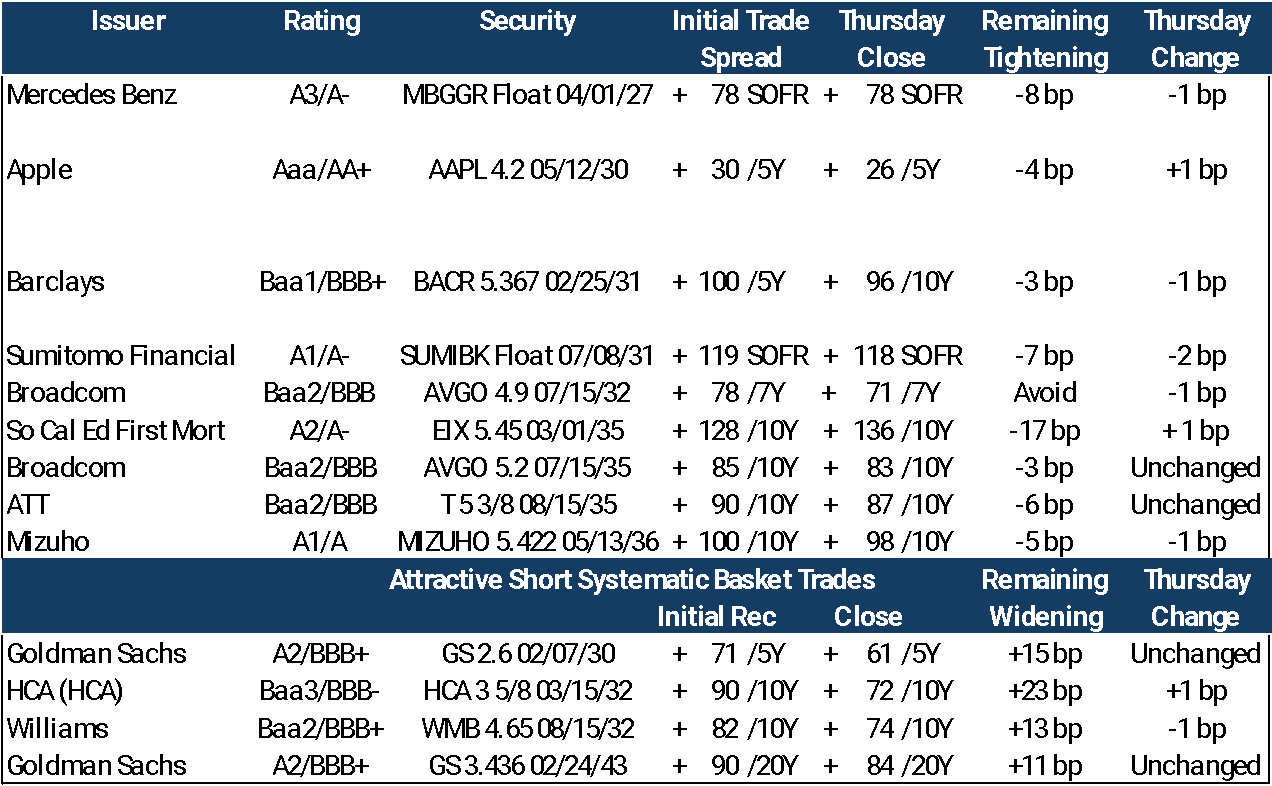
Most Recent Systematic long/short trades:
Today the model adds the Nissan (Ba2/BB) NSANY 7 ½ 07/17/30 with (-10bp of projected spread tightening.
Systematic Long/Short Basket Trade Performance Report (January 4, 2025 – July 10, 2025)
Total Trades: 130 (1% of total recommendations).
Performance Summary:
Long Recommendations: 90/99 reached avoid-trading levels, tightening by -9.55 bp.
Short Recommendations: 27/31 reached avoid-trading levels, widening by +5.49 bp.
Remaining Longs: 9 tightened by -1.11 bp.
Remaining Shorts: 4 tightened by -10.75 bp.
Average Spread Movement: ±7.45 bp in the recommended direction.
Success Rate: 90% of recommendations reached avoid-trading levels which is normal.
Average trade holding period: (22 trading days) + 17% above normal.
Thursday’s G -255 reported results:
Delta Airlines (DAL, Baa2/BBB- attractive long) 2Q ended June 30
Delta Airlines (DAL): Delivered stronger-than-anticipated 2Q 2025 results, with passenger revenue unchanged YoY on stable pricing and cargo revenue rising 7% year-over-year. Delta projects a June quarter operating margin of 11% to 14% and intends to maintain flat capacity growth year-over-year in the second half to balance supply with demand. DAL is focusing on capital retention and debt reduction.
Financial Position: In the quarter, DAL cut debt by $800mm to $15 billion, despite a 50% YoY increase in its quarterly dividend. As of June 30, 2025, the company holds approximately $3.5 billion in short-term debt and leases and $3 billion in cash.
Trading Model Indicator: Our credit trading model considers DAL’s secondary trading curve attractive. However, following the recent DAL unsecured debt offering (3Y and 5Y $1 billion deals priced on June 5), which tightened by -10bp, the bonds would require at least +5bp of spread widening to market to trigger an attractive long recommendation from the model.
Trading Model Equity Indicator: DAL Equity is an attractive below $54.42. The equity closed @ 56.78 on Thursday.
Disclaimer - This report is not intended as, and does not constitute an offer, or a solicitation to buy or sell any securities or financial instruments. All data, levels, opinions, and representations herein are provided for informational purposes only and should not be relied upon for making investment decisions. Past performance is not indicative of future results. The authors of this report assume no liability for losses or damages arising from the use of this information. Investors should consult with a qualified financial advisor before making any investment decisions. The information in this report is based on sources believed to be reliable, but no guarantee is made as to its accuracy, completeness, or timeliness.