SYSTEMATIC CREDIT TRADING MODEL INDICATOR PERFORMANCE 2024 - 2025
As we head towards the end of the year and a slower than average week for risk trading, we showed G-255 credit indicator performance on Monday. Today we show how the same trading indicators (6,000/per day) are used for both credit and equities to produce to decile risk/volatility results.
At its core, the G-255 is a quantitative, rules-based model that systematically processes data from the 255 largest, most liquid, and heavily indebted global corporate issuers—the bellwethers of CDX/HY, CDX/IG, and iTraxx indices, which account for >70% of cash bond and CDS trading volumes. Unlike discretionary strategies, it recalibrates quarterly during earnings seasons, ingesting standardized financial disclosures to dynamically update signals. This operational rigor ensures timely, high-conviction trades across credit and equity markets. Here’s a breakdown of its key mechanics:
Universe: 255 largest, most liquid, heavily indebted global corporates (the exact names that drive CDX.NA.HY, CDX.NA.IG, and iTraxx)
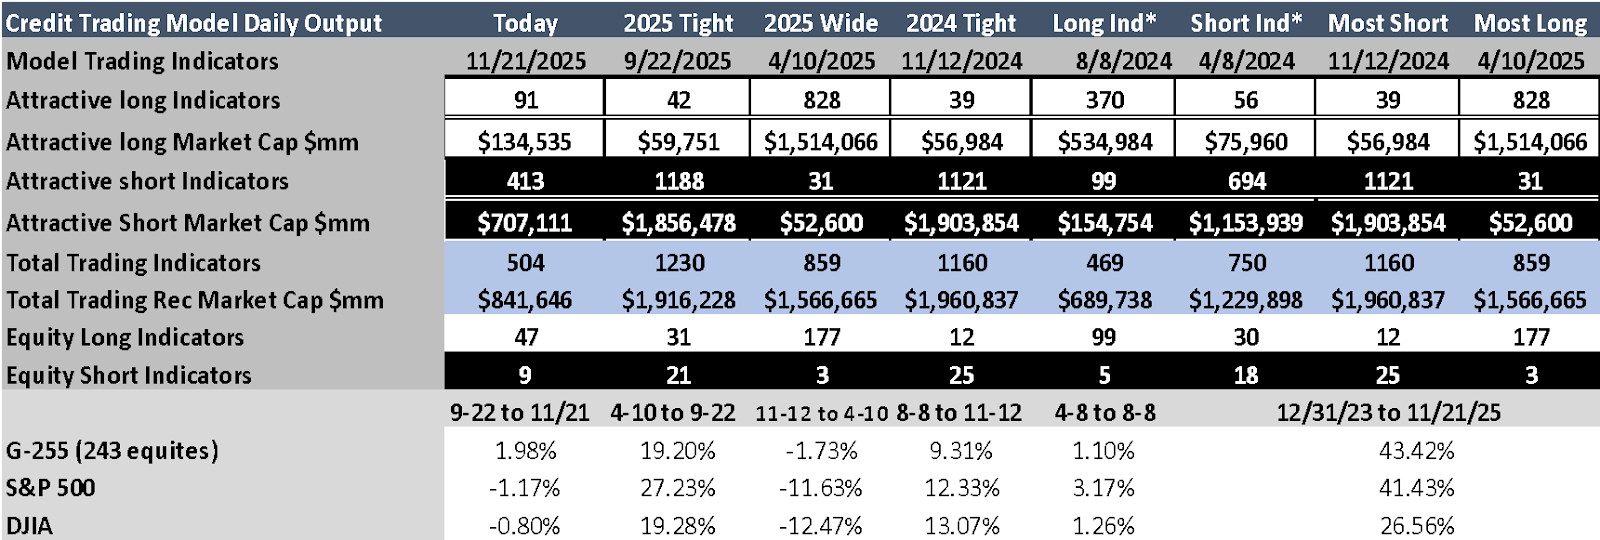
Daily Systematic indicator → single macro signal (Widening = trough / Tightening = peak)
For the 243 dual-listed issuers: synchronized equity/credit indicators → long equity / short credit (or reverse) pair trades
Proven edge: has called every major credit cycle turn on the exact day since 2018 (zero false positives). How the G-255 Operates (Core Mechanics)
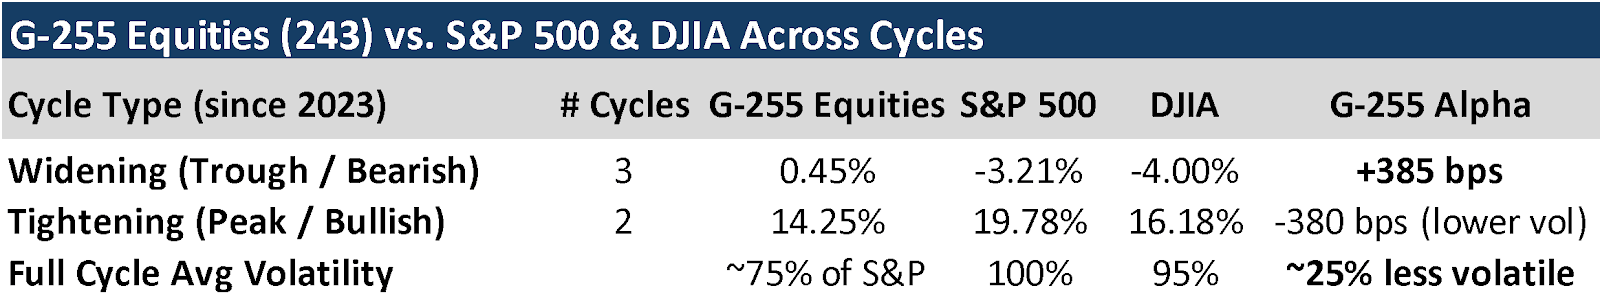
Key takeaway:
In troughs (widening) → G-255 equities fall far less (+385 bps outperformance)
In peaks (tightening) → capture most of the rally with materially lower volatility → Superior risk-adjusted and compounded returns over full cycles
Why the 243 G-255 Equities are significantly less volatile than US equity Indexes
Avg market cap: $172 bn (larger, more stable)
80 Issuers are non – US companies
Dividend yield: >3.5% (vs ~1.4% S&P 500)
Shareholder yield: >50% of net earnings returned (debt market access advantage)
Current Signal – 23 Nov 2025
Neutral → slightly inexpensive Spreads have tightened but not yet enough for a fresh “Long Equities” trigger. Select mega-cap Tech & Consumer names already flashing isolated long signals → potential early trough accumulation setup into year-end.
Daily signals & issuer rankings: “Systematic Trading” Substack report Top Equity long indicators are shown below.
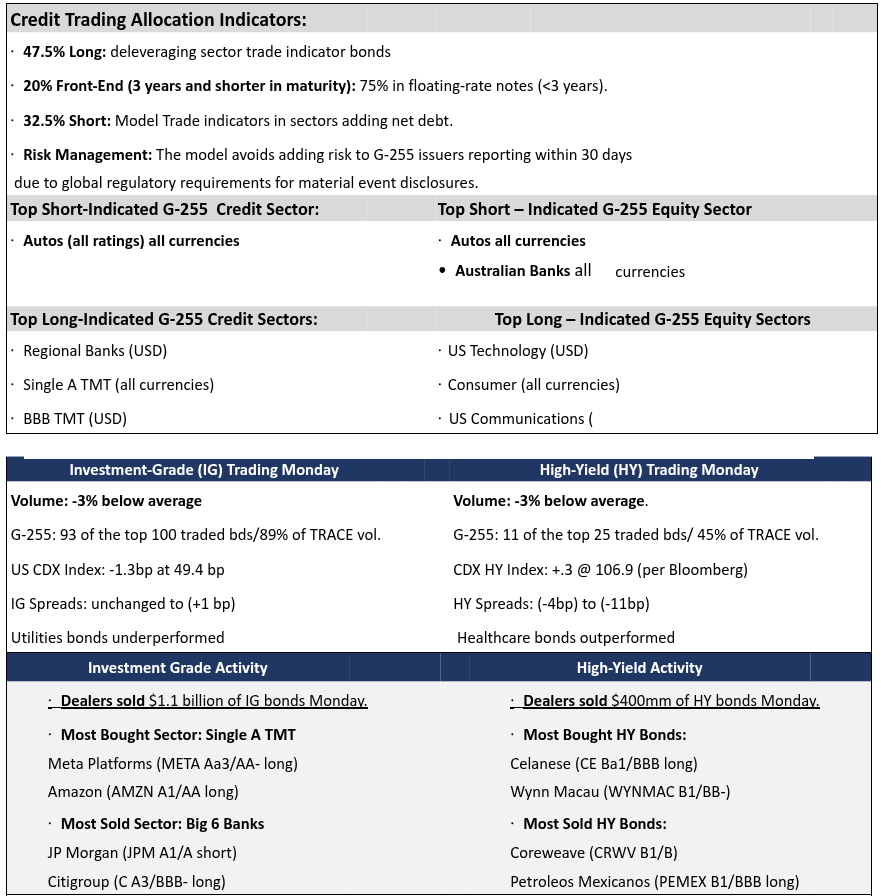
G-255 Credit Trading Sector Indicators and Monday Credit Trading
With US credit flows near a standstill, the widening in overall credit remains the path of least resistance for both credit markets. G-255 equities have from a long only perspective outperformed US equity indices and USD credit. This owes primarily to the % of financials in the G-255 and that 40% of the equities are non - US based. Credit indicators are now (slightly) undervalued for the first time since June. However, absent credit inflow and movement in underlying equity prices, the patch for credit spreads remains the same. No indicator changes in the Systematic Trading Model trade allocation for either credit or equities overnight.
Top traded IG G – 255 issuer: Meta Platforms (Aa3/AA- Hold credit/long equity) unchanged on Monday
Top Traded HY G – 255 issuer: Petroleos Mexicanos(PEMEX B1/BBB long credit) (-5 to -12bp) on Monday
2
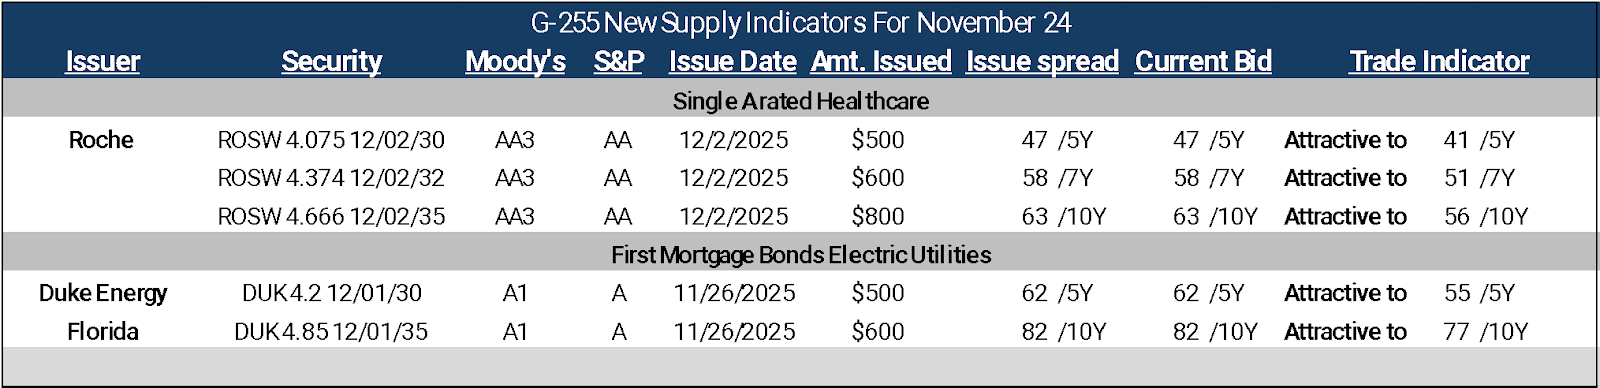
G-255 Credit Market Valuation and New G – 255 Supply November 25
Source: Bloomberg Capital Markets
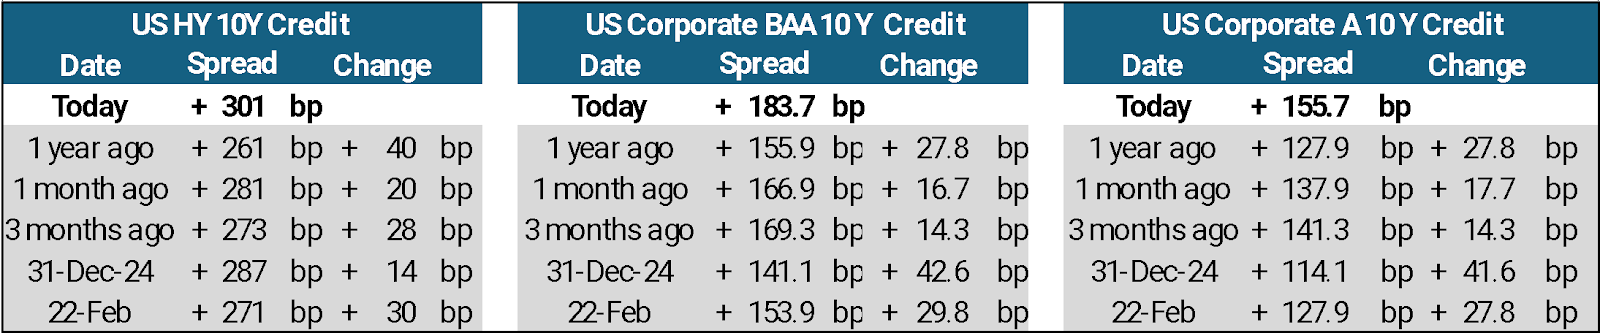
On a Risk/Reward basis, High Yield bonds have far outperformed Investment Grade in 2025
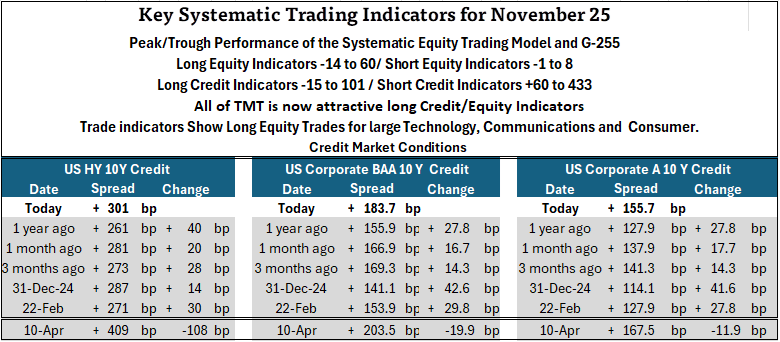
UST 10-Year Rates: -24.3bp YoY and -51.4bp YTD. February 21, 2025, was the tightest spread date of 2025.
Bloomberg 10Y credit spreads are derived by taking the Moody’s index yield and subtracting the UST 10Y YTM.
Two more G-255 issuers came to market on Monday, selling 5 more bonds and bringing the month’s total to 71 bonds totaling $89.9 billion of USD debt. Roche (ROSW Aa3/AA) came to market selling $1.7 billion of 5Y, 7Y and 10Y paper after Novartis (NOVN.VX Aa3/AA-) and Pfizer (PFE A1/A+) accounted for 12 bonds and just over $11 billion of debt which has not traded well. The Roche deal was scaled down in size, priced more attractively according to the trading model and had no longer-dated bonds, which in the Novartis and Pfizer deals have not traded well.
Duke Energy Florida (DUK A1/A) sold 5Y and 10Y First Mortgage Bonds that were also seen as attractively priced by the Systematic Trading model.
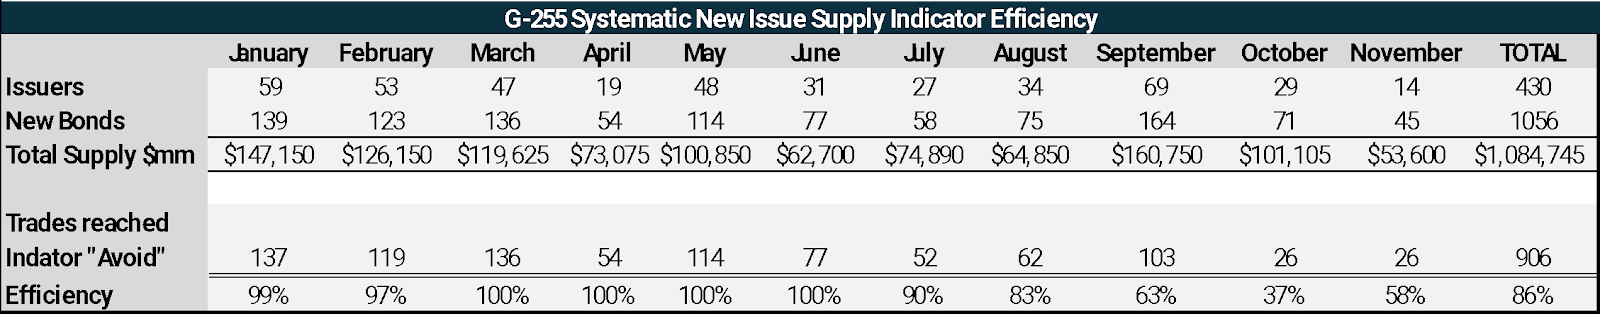
We will review the October/November new supply in the next G-255 new supply report.
Of the G-255 bonds issued through November 12, 2025, 906 of 1056 (86%) reached their avoid trading levels.
3
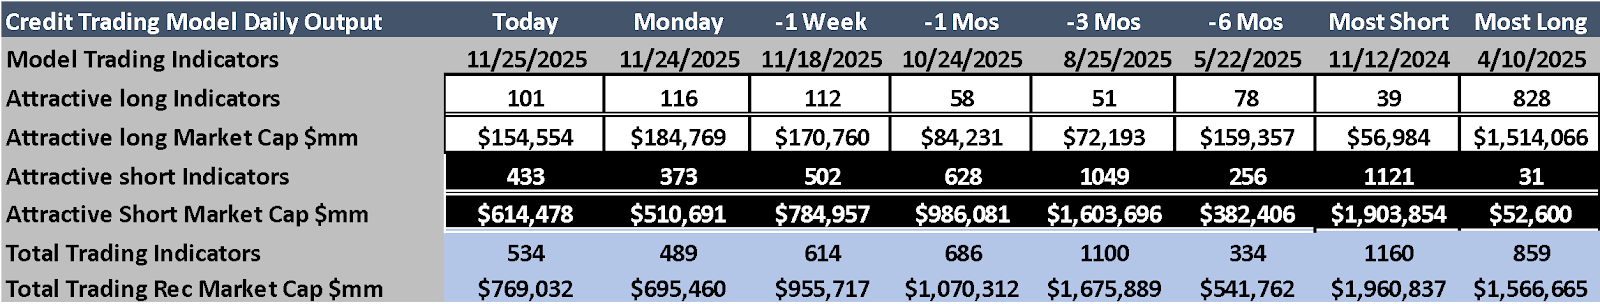
G-255 Credit and Equity Market Indicators November 25
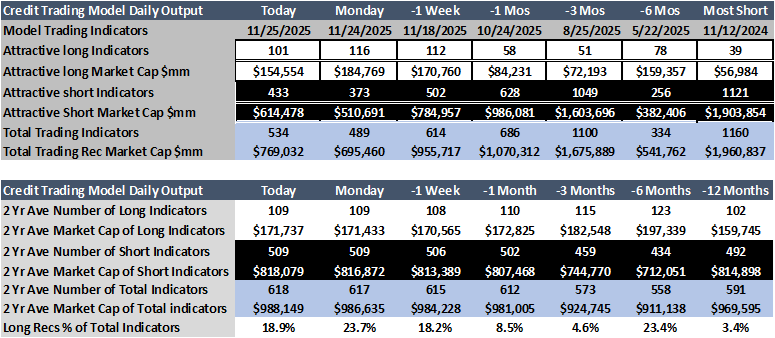
Attractive Long Credit Indicators: 116, (-15 from Monday and -7% below the 200-day moving average of all long indicators). 18 long credit indicators are not included owing to the underlying equity price declines of more than -10% in the past 30 calendar days.
Attractive Long Credit Market Cap accounts for:33% of all undervalued Systematic Credit capital.
Attractive Short Credit Indicators 433, (+60 from Monday and -15% below the 200-day moving average of all model short trade indicators).
Attractive Short Credit Market Cap accounts for: 26% of all overvalued Systematic Credit capital.
G-255 Equity Trade Indicators and US Equity Correlation to Overall US Credit Spreads
US equities and credit markets failed to correlate directionally for a second straight trading day as US credit was unchanged equity indexes were higher.
US equities are now slightly higher WoW; US credit markets are slightly wider in the week ended November
24
US equities are -1.3% lower over the past month, US credit spreads are now materially wider MoM.
2025 is on track for the second-weakest year in 32 for USD credit-equity correlated movement—historic 80% vs. ~74% this year.
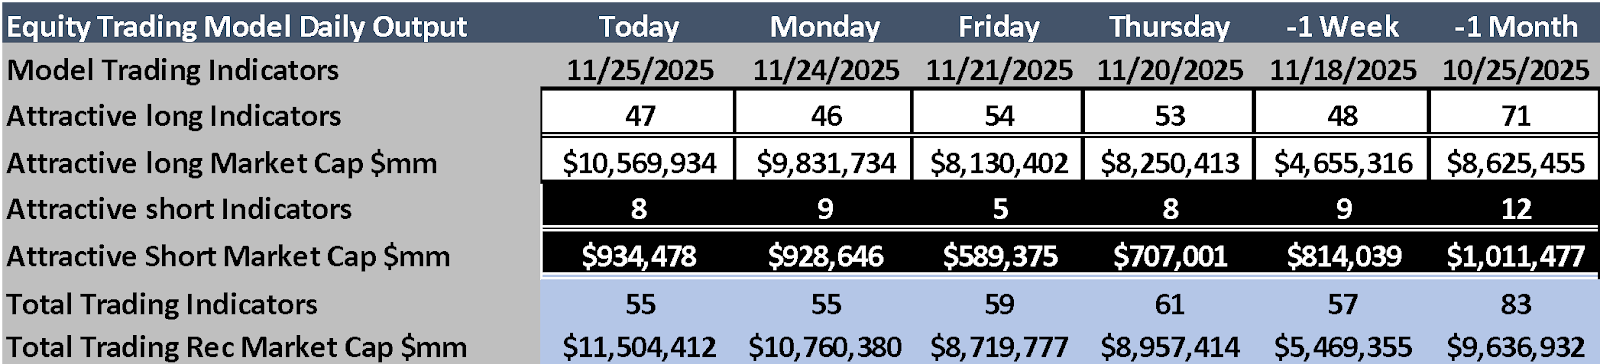
Systematic Equity Trading Indicators November 25
• Attractive Long G-255 Equity Trade Indicators: 60 (includes both undervalued and equities priced at
extreme discount (-14 from Monday and +6% higher than the 200-day moving average of all long trade indicators).
• Attractive Short Equity Trade Indicators 8, (-4 from Monday and -14% below the 200-day moving
average of all model short trade indicators).
For G-255 issuers, equity prices of the world’s most indebted companies were +.3% Monday and -.04% over the past week, while the S&P 500 rose +1.55% Monday and +.49% over the past week.
Why are G-255 equity issues outperforming the S&P and Dow? A: Over 30% of the 242 publicly traded G -255 equities have already reached their 2025 low price and 40% of the G-255 issuers are non – US corporates.
G-255 issuers are returning more capital to shareholders (via dividend growth and share repurchase) than S&P issuers as a whole.
Highest ranked equity long indicators on Tuesday:
Meta Platforms Inc (META) Mastercard Inc (MA) Comcast Corp (CMCSA)
G-255 issuer news Monday
BHP Group (BHP A1/A short credit/long equity) released a statement stating it is “no longer considering
acombination of the two companies” after a renewed takeover approachto Anglo American
Plc, (AALLN Baa2/BBB short credit/long equity) according to weekend Bloomberg report. Anglo American sin
the process of acquiring Teck Resources Ltd. in an all-stock deal.
4
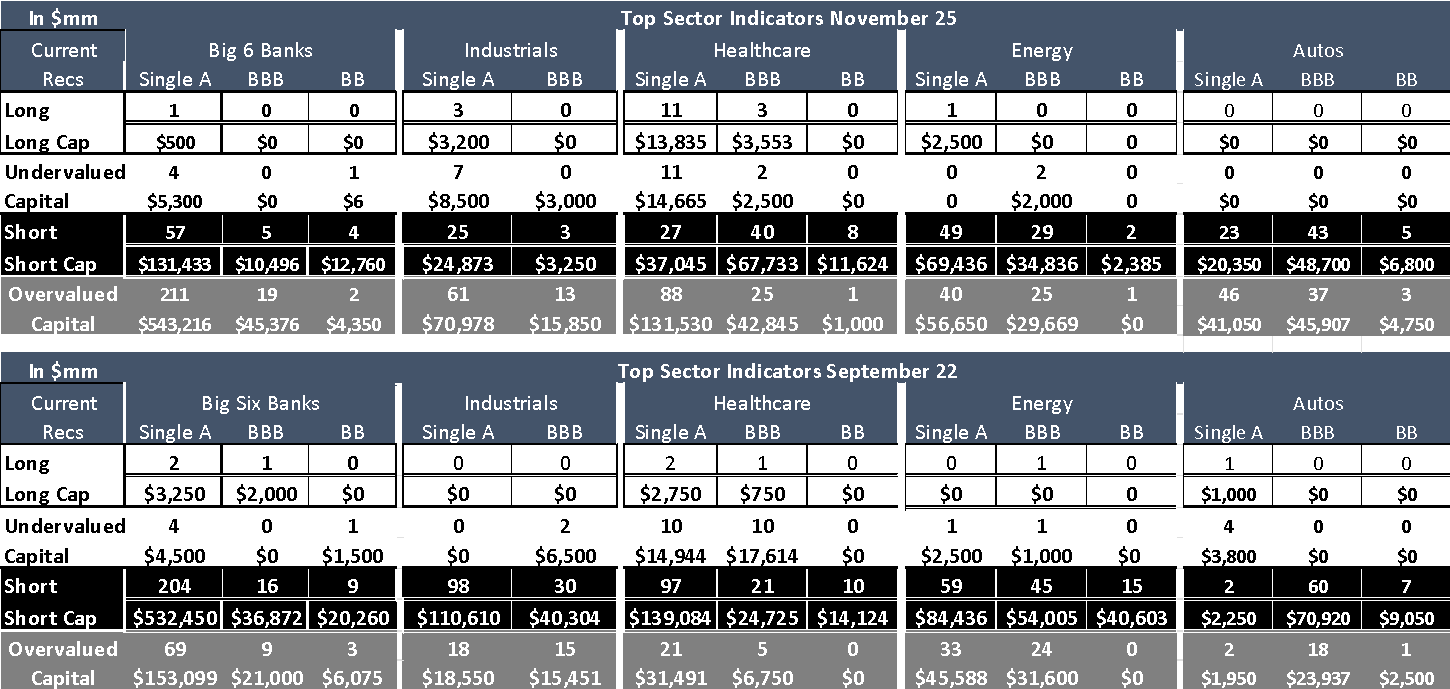
G-255 Specific Credit Sector Indicators November 25
Long Opportunities:
Focus on de-leveraging issuers, including Single A and BBB-rated TMT, UK Banks, US Regional Banks, and Floating Rate Notes.
Valuation Insight: The stochastic credit trading model identifies 284 undervalued bonds ($495.5 billion market
value), with 116 long trade indicators across the 6,000-bond USD universe.
At present only Single A rated TMT, BBB rated TMT, BB rated TMT and US Regional Bank sectors have 10+ long individual bond trade indicators.
Short Opportunities
1,483 bonds ($2.27 trillion) are overvalued per the stochastic credit trading model, with 433 short trade indicators.
U.S. Big 6 Banks (all ratings):No longer a short indicator as of October 22. Bonds +6 to +20 bp since 9/22.
Single A and BB Energy: No longer a short indicator as of October 27. Bonds +6 to +19 bp since 9/27.
Single A Healthcare: No longer a short indicator as of October 22. Bonds +5.5 to +17 bp since 9/22.
Single A Industrials: No longer a short indicator as of October 22. Bonds +6.5 to +20 bp since 9/22.
Autos: 157 bonds ($167.6 billion) are overvalued, with 71 short trade indicators
Systematic Portfolio Daily Trading Model Indicators
Long Indicators: Target deleveraging new issues with attractive valuations, focusing on 5-year maturities.
Short Indicators: Target releveraging issuers trading at the deepest discount from their model avoid point, avoiding 7-year maturities due to low attractiveness.
Replace Longs: Swap long positions that have reached their avoid trading level.
Portfolio Trading Hurdle: Maintain a 1:1 long-to-short ratio once the 67.5% long position threshold is reached.
Current Status: Add new supply trades where the issuer is deleveraging; add new issue bonds where spreads widened by +2 basis points.
Current Status of Trading Indicators: Last week, one short trade and two long trades reached their avoid trading level. The trading model added three long indicators.
Monitor Trade Position Composition:
Track the percentage of long positions relative to the total portfolio.
If replacing long positions that have reached their avoid trading level pushes the portfolio above the 65% long hurdle, initiate short positions in releveraging issuers (avoiding 7-year maturities) at a 1:1 ratio for additional long positions.
Review: Reassess portfolio balance after today’s fund flow data to ensure alignment with the systematic strategy.
Look for individual bond indicators to change overnight: Historic trading levels are leading to overnight adjustments to long, short and avoid indicator levels.
5
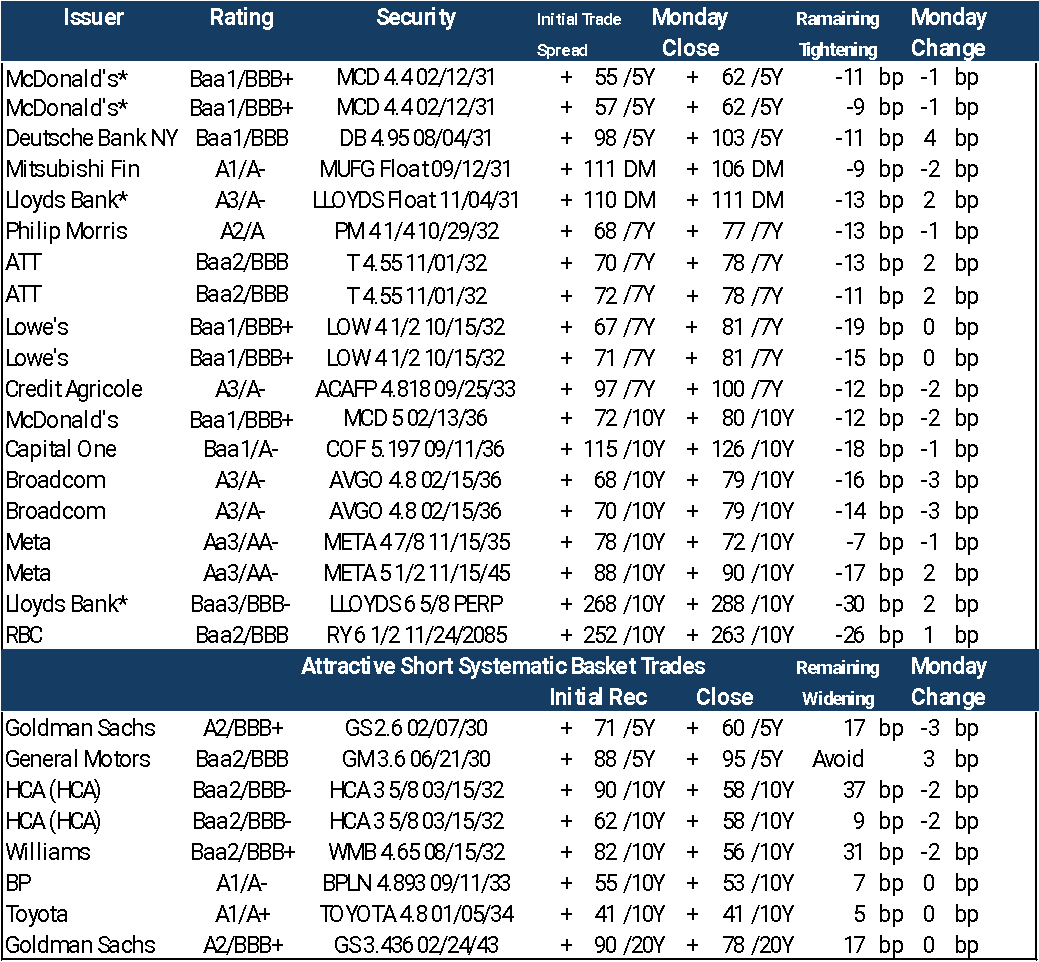
G-255 Specific Bond Trading Indicators November 25
Closed Positions: The Cigna (Baa1/A-) CI 2.4 03/15/30 (short) and Amazon (A1/AA) AMZN 4.35 03/20/33(long) both reached their avoid trading levels Wednesday November 19. The Truist Bank (Bank Sub A3/A-) TFC 2 ¼ 3/11/30 short trade indicator reached its avoid trading level on Friday November 21. The General Motors (Baa2/BBB) GM 3.6 06/21/30 short trade indicator reached its avoid trading level on Monday 11/24.
Enter New Longs: The trading model added Meta (AA3/ AA-) META 4 7/8 11/15/35 and META 5 1/2 11/15/45 new supply long trade indicators on 11/7. The new Amazon (A1/AA) AMZN 4.35 03/20/33 was added to the Model Trade on Monday 11/17.
Enter New Short Trades: The trading model added General Motors (Baa2/BBB) GM 3.6 06/21/30 as a short trade on Monday 11/17. The trading model added BP (A2/A) BPLN 4.893 09/11/33 as a short trade on Thursday 11/20, the Toyota (A2/A) TOYOTA 4.8 01/05/34 Friday 11/21 and the CVS (Baa3/BBB) CVS 1 3/4 08/21/30 on Monday 11/24
Current Sample Systematic Basket bond trades based on trading strategy November 24
Systematic Trading Indicators Monday: General Motors (Baa2/BBB) GM 3.6 06/21/30 short trade indicator reached its avoid trading level. The Systematic trading model replaces the closed-out trade adding the CVS (Baa3/BBB) short trade indicator CVS 1 ¾ 08/21/30. 6
Performance Summary: Total Trades: 188 (1% of total trade indicators).
Long Indicators: 126/145 reached avoid-trading levels, tightening by -9.2 bp.
Short Indicators: 35/43 reached avoid-trading levels, widening by +5.84 bp.
Remaining Longs: 19 widened by +6.7 bp.
Remaining Shorts: 7 tightened by -9.89 bp.
Average Spread Movement: ± 6.15 bp in the recommended direction.
Success Rate: 86% of indicators reached avoid-trading levels, which is slightly below normal.
Average trade holding period: 22.7 days (above average)
Disclaimer - This report is not intended as, and does not constitute an offer, or a solicitation to buy or sell any securities or financial instruments. All data, levels, opinions, and representations herein are provided for informational purposes only and should not be relied upon for making investment decisions. Past performance is not indicative of future results. The authors of this report assume no liability for losses or damages arising from the use of this information. Investors should consult with a qualified financial advisor before making any investment decisions. The information in this report is based on sources believed to be reliable, but no guarantee is made as to its accuracy, completeness, or timeliness.