


Systematic Credit Summary - May 1
How to trade Earnings Season!

Good morning! Just 1 UK bank Lloyds (LLOYDS) reporting out of Europe this morning owing to the May Day work holiday. Regardless of analyst responses and concerns over LLOYDS' relatively small exposure to US trade tariffs, the bank had flat operating earnings on stronger revenues and is now down to a grand total of £5 billion of net debt. We open with the Lloyds results to highlight that 100 of the world’s largest issuers have reported results and the financial press in many cases is simply altering what the issuers are actually reporting.
The key issues relating to credit trading are (1) money flowing out of US credit. (2) large cap € issuance for the largest issuers of corporate debt. (3) less large cap $ issuance for the largest issuers of corporate debt. (4) US syndicates are selling bonds that don’t have much follow-on demand. (5) With the exception of large cap technology and non-US bank corporates, the world’s largest borrowers are leveraging their balance sheets faster than their revenue streams are growing.
The corporate debt market is responding to the above-mentioned facts as is the US equity market. This is the first time we have seen this divergence since 2007. How does it end? A: Well, thanks to a number of banking and capital rules that now exist globally, I have no idea.
So while Microsoft (MSFT), Meta Platforms (META), and Qualcomm (QCOM) reported impressive results and have US equity futures higher, the other 106 issuers that have reported thus far are telling a different story.

Earnings Season
42 of the world’s 250 largest issuers of corporate debt reported results on Tuesday and Wednesday. If you want financial exposure, Deutsche Bank (DB), HSBC (HSBC), BBVA (BBVASM), BNP (BNP), Toronto Dominion (TD), Barclays (BARC), and LLOYDS (LLOYDS) are your best bets. If you are looking for financials to short, US Big 6 banks (at tighter levels) are what our trading model recommends.
Of the 109 issuers that have reported results as of last night, non-US issuers are raising debt at a slower pace (+1.3% QoQ) compared to US issuers (+3.7% QoQ), and that trend is continuing this AM.
Thus far, 57 of the world’s 66 largest corporate debt issuers reporting results are adding net debt.
Wednesday’s US IG Credit Trading:
We saw more end-of-month trading, with volumes (+49%) higher than normal and sellers of UnitedHealthcare (UNH), Verizon (VZ), BNP (BNP), Apple (AAPL), General Motors (GM), and Comcast (CMCSA). Dealers bought $2.4 billion of USD IG bonds on Wednesday, with the majority of the bonds sold to dealers in the long-duration part of the overall IG credit curve. The US IG CDX spreads and cash bonds widened (+3.5bp) Wednesday, while healthcare and consumer were the best-performing sectors. The worst-performing sectors? A: All of the other bonds.
How to trade Earnings Season
As noted, with almost half of the world’s largest issuers reporting, we are seeing 5 trends:
(1) US issuers are adding net debt faster than non-US issuers.
(2) Non-US banks are deleveraging, and US Big 6 banks are releveraging.
(3) Every consumer issuer that has announced earnings has reported a releveraging.
(4) All but 3 Single A industrial issuers are adding to their balance sheets.
(5) The vast majority of the world’s largest issuers are generating enough cash to cover returns to shareholders and have little intention of not using their respective balance sheets to continue payouts.
Trading Strategy: The model trading output continues to recommend:
Long Positions: Attractive bonds (or new supply) from issuers that have already reported results.
Short Positions: Issuer bonds trading within 20% of their 52-week tight spread, where the underlying company is releveraging its balance sheet.

Issuer News on Wednesday
Southern California Edison's (EIX) parent company said Tuesday that the company was likely to suffer "material losses" related to the deadly Eaton fire, which ignited on Jan. 7 and burned more than 14,000 acres.
Airbus (AIRFP) confirmed its aircraft-delivery and financial targets for the year but said its guidance excluded any effects from President Trump's tariffs because it is too early to quantify them. Airbus also stated they will be passing on US tariff expenses to US airlines going forward. We will provide our write-up on AIRFP later today. Airbus has twice as much cash + marketable securities ($30 billion) as total debt and reported a strong 1Q operating result.
Inflation Readings and Government Bonds
The personal consumption expenditures price index stagnated from a month earlier for the first time in nearly a year.
US consumer spending jumped 0.7% last month, the most since the start of 2023.
The markets are buying it. UST 10Y yields are (-44bp) lower.
U.S. IG Credit Valuation
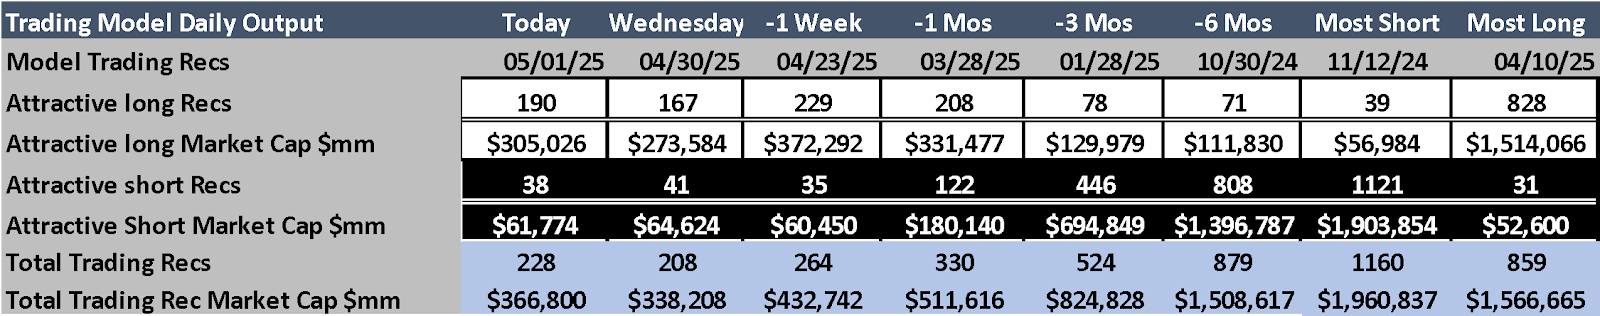
US investment-grade (IG) credit continues to be the "most attractive" for long credit recommendations for the 31st consecutive trading day. See details in the Model output section below.
Global Equity Correlation to IG Credit Spreads
Wednesday saw credit spreads in Autos, Euro and UK banks, and Industrials widen in line with equity price declines post-earnings. At the same time, US single A TMT credit spreads are not following higher US tech equity prices. This is another indication of divergence in certain trading sectors from the typical US IG 10Y credit spread correlation to US equity index price movement.
Over 175 bonds trade more than 45% from spreads that would bring our model to consider most consumer bonds an attractive short trading recommendation.
New Supply / Bond Maturities / Credit Fund outflows for April
One new global 250 issuer selling USD bonds on Wednesday: BNP (BNP), which reported a deleveraging balance sheet last week. The other new issue bonds (Orbia, Bahrain, Abu Dhabi, Weir Group, Jefferson Capital) are causing credit markets to slip owing to lack of appeal for large managers to inventory those bonds. Alphabet (GOOGL), Philip Morris (PM), and Walmart (WMT) have continued, however, to outperform.

We saw over $100 billion of G-250 USD coupon payments and bond retirements.
We also saw the largest amount of capital outflow ($30+ billion) from corporate bond and ETFs during the month of April. We had commented on that outflow not having the expected impact on credit spreads. That trend (capital outflow) combined with unwanted new supply helped overall US IG credit spreads widen materially over the past 3 days.
Systematic Trading Model Indicators – Thursday
We saw US IG spreads widen more significantly on Wednesday as dealers struggled with new issues that are not G-250, and end users will not be building large positions in recent new bonds from Bahrain, Abu Dhabi Development, and Weir Group PLC. The vast majority of the late April issue calendar failed to trade well all week. This leaves at least (-17bp) of overall credit spread tightening before our model would begin to show significantly more attractive short trading recommendations.

Of the 109 issuers that have reported results as of last night, non-US issuers are raising debt at a slower pace (+1.3% QoQ) compared to US issuers (+3.7% QoQ), and that trend is continuing this AM.
Thus far, 57 of the world’s 66 largest corporate debt issuers reporting results are adding net debt.
The model maintains its "long-only" stance across its 6,200-bond, 250-issuer USD large-cap universe for the 31st consecutive trading day. Attractive short recommendations remain near five-year lows, with over 83% of model recommendations classified as attractive long.
Attractive Trading Sectors
Attractive Long Trading Sectors: US Single A rated technology, US Regional, UK, European, and Canadian Banks are the most attractive long trading sectors this morning within the 6,200 USD bond universe analyzed daily by our model.
Attractive Short Trading Sectors: None. The consumer sector is releveraging. Consumer credit spreads are (+15bp) wide of attractive short trading levels. Single A Industrials (-18bp) tighter, all but 2 Single A rated industrial issuers (Boeing (BA) and GE Aerospace Bateman (GE)) are adding net debt to their respective balance sheets. US Big 6 banks are also attractive short trading recommendations (-12bp) tighter from current trading levels.
Systematic Credit Recommendations
Our systematic strategies employ defined trading processes and portfolio construction parameters. This clarity differentiates them from discretionary approaches, offering replicable and auditable methods. We rely only on stochastic trading algorithms to identify opportunities, backtested on historical data to validate strategy performance. We target ±5 basis points of credit spread movement in minimal trading days, balancing return maximization with volatility risk.
Most Recent Model Trading Recommendations

With the new BNP Baa1/A- USD deal, the model sees the BNP Float 05/09/29 and the BNP 5.085 05/09/31 as the most liquid attractive bonds in the Euro Yankee sector. In addition, the model adds the Barclays Baa1/BBB+ BACR 5.367 02/25/31 as a “double down” on the model’s attractive recommendation from mid-February with (-11bp) of credit spread tightening.
Tuesday Sample Trading Recommendation Credit Spread Movement
Since February 24, we’ve published 30 secondary and new-issue trading recommendations from our model:
• 12 recommendations have reached their avoid-trading level.
• The remaining 18 recommendations have widened by an average of +7.3 bp.
• Across all 30 recommendations, credit spreads are +.43bp.
Prior long/short trading recommendations
Of the 46 new-issue and secondary trading recommendations published (22 long and 24 short) that reached their avoid trading level, the average credit spread movement was (+/-5.6bp).
Of the 10 long recs issued before February 22 that haven't yet hit the avoid-trading threshold:
• Four are BBB-rated and have widened by 33 bp on average since being recommended.
• They currently trade at 158 bp over the UST curve, with an 8.3-year duration.
• Our model projects an average spread tightening of -38.3 bp remaining.
• Six are single-A rated and have widened by +23.1 bp since recommendation.
• They now trade at 115.1 bp over the UST curve, with a 10.7-year duration.
• The trading model indicates an average spread tightening of -27 bp remains.
Earnings results from yesterday and last night
Mercedes Benz Group (MBGGR, A3/A-)
• Mercedes Benz reported overall unit sales that fell (-4%) YoY in 1Q 2025 with entry-level vehicles growing and luxury-level vehicles falling by (-2%). The net result was revenue that fell (-7%) YoY and net earnings that fell (-43%). Cash flow from operations was actually higher YoY. While the headlines continue to gravitate around US trade tariffs and the company is dropping 2025 guidance until those issues have more clarity, the US accounts for 15% of MBGGR's total sales W. The 1Q decline in sales was more pronounced in China, which represents 8.5% of sales but was down (-39%) YoY.
• Financial Position: MBGGR pays its dividend once per year in May and hence the Mercedes balance sheet normally follows unit sales in Q1, Q3, and Q4, and Q1 2025 was no different. The MBGGR balance sheet is deleveraging, and the company cut its dividend to just over €4 billion for 2024.
• Model Trading Recommendation: There is no regular pattern to Mercedes Benz Group (MBGGR) USD supply. Some years they come to the US market once. In 2024, they borrowed in the US market 3 times. The company has very stable cash flow, and borrowing normally follows unit sales. Our trading model continues to see the MBGGR Float 04/01/27 issued @ DM 78 and trading @ DM 95 as the most attractive Mercedes secondary issue. The model also sees the MBGYY ADR (8.23% gross yield and 9.2% dividend growth) as an attractive long recommendation.
Volkswagen Group America (VW, Baa1/BBB+)
• Volkswagen reported 1Q revenue that rose 4% while net earnings fell (-37%) YoY as a result of litigation, restructuring, and CO2 fleet European fleet expenses. VW is still forecasting 5% revenue growth for 2025. Cash flow from operations was slightly negative in 1Q 2025.
• Financial Position: Negative operating cash flow and positive sales in the auto industry normally lead to more on-balance-sheet debt. So it comes as no surprise that there was no net debt reduction on the VW balance sheet in 1Q 2025. YoY net debt is €19 billion higher, at €187 billion.
• Model Trading Recommendation: VW America has $1.9 billion of debt coming due in the next 6 weeks. There is a 52% chance we see another VW bond deal over that period. That said, the parent company has over €63 billion of cash and short-term investments and €200 billion+ in stated equity. Our credit trading model sees the VW America secondary credit curve as an attractive short trading recommendation (-15bp) tighter than current trading levels.
Equinor (EQNR, Aa2/AA-)
• Equinor reported 1Q revenue growth of 6% and flat earnings. However, the markets focused on the cancellation of Empire Wind, which was about 30% finished when the Interior Department halted it on April 16, citing inadequate environmental review. The net exposure for EQNR is $4.5 billion. Equinor is sticking with 2025 guidance, which includes a 4% production increase and, of course, lower market prices. • Financial Position: Cash flow from operations is at a 6-quarter high. This has enabled EQNR to spend $2.5 billion on shareholder returns and still deleverage its balance sheet. Equinor stated on its call on Wednesday its plan to continue $1.5 billion of additional share buybacks.
• Model Trading Recommendation: Our trading model again sees the Equinor secondary trading curve as an attractive long trading recommendation with the EQNR 5.1 08/17/40 the most attractive bond.
TotalEnergies (TTEFP, Aa3/A+)
• TotalEnergies reported 1Q production growth of 4%, a (-7%) decline in YoY revenue, and a (-33%) decline in net earnings. Despite the decline in earnings and negative cash flow after financing activities, TotalEnergies (TTEFP) will continue to repurchase equity and grow its dividend.
• Financial Position: Total net debt, while $9 billion higher than 4Q 2024 and $9 billion higher YoY, is still well below its $41 billion peak in 4Q 2020.
• Model Trading Recommendation: Our trading model again sees the TotalEnergies secondary trading curve as an attractive short trading recommendation with the TTEFP 2.829 01/10/30 the most attractive bond.
Société Générale (SOCGEN, Baa2/BBB Sr. Non Preferred)
• SocGen reported record 1Q operating results using similar strategies to the US Big 6 banks but with less balance sheet risk. CET1 capital is now up 13.4% at the end of Q1 2025, and net charge-offs on the SOCGEN loan book continue to fall. Credit quality continues to improve, deposits are stable, and global markets income rose 11% YoY.
• Financial Position: SocGen has more cash than debt, one of the highest CET1 capital ratios in Europe, and is managing its dividend policy and share repurchases to keep balance sheet liquidity strong.
• Model Trading Recommendation: The last time SocGen sold USD bonds in May? “Never happened.” According to our trading model, there are 14 undervalued USD bonds in the SocGen secondary trading curve. The model sees the SOCGEN 5.519 01/19/28 as the most attractive.
Meta Platforms (META, Aa3/AA-)
• Meta net earnings were $16.64 billion, +35% from 1Q 2024. Revenue rose 16% to $42.31 billion. Meta raised 2Q forecast revenue to $42.5 billion to $45.5 billion, +14% YoY.
• Financial Position: Meta has $41 billion of net cash on its balance sheet.
• Model Trading Recommendation: Our trading model sees 8 of the Meta Platforms (META) secondary bonds as undervalued from a long perspective. The META 4.45 08/15/52 is the most attractive bond according to our trading model.
Microsoft (MSFT, Aaa/AAA)
• Microsoft 3Q revenue rose 13% to $70.1 billion, while adjusted profit was $3.46 a share, beating analysts' estimates. Azure cloud revenue grew 33% YoY in 3Q 2025 and is expected to grow as much as 35% in the current quarter.
• Financial Position: Microsoft has a higher credit rating than the United States of America. Why? A: Microsoft has the better balance sheet.
• Model Trading Recommendation: Our trading model made a similar recommendation in March. 6 of the 11 liquid MSFT bonds are seen as undervalued by our credit trading model. The MSFT 4 1/4 02/06/47 is seen as the most attractive.
Qualcomm (QCOM, A2/A)
• Qualcomm 2Q revenue came in at $10.8 billion (+17% YoY), above analysts' expectations of $10.6 billion. But Qualcomm forecast a revenue range for 3Q of $9.9 billion to $10.7 billion—at the midpoint, that's slightly below the consensus of $10.33 billion.
• Financial Position: Qualcomm has $777 million of net debt and is deleveraging.
• Model Trading Recommendation: 6 of the 11 liquid QCOM bonds are seen as undervalued by our credit trading model. The QCOM 4.65 05/20/35 is seen as the most attractive.
Caterpillar (CAT, A2/A)
• Caterpillar 1Q revenue came in at $14.2 billion (-9.2% YoY), below analysts' expectations of $15.6 billion. CAT also forecast a $250 - $500 million headwind associated with US trade tariffs in 2Q 2025 and a $5 billion increase in backlog. Caterpillar did not raise 2Q guidance and sees 2025 revenue flat with 2024 prior to any tariff impact.
• Financial Position: Caterpillar is the PepsiCo of the industrials trading sector. Management uses balance sheet leverage to return capital to shareholders. Caterpillar has $37 billion of net debt and is leveraging.
• Model Trading Recommendation: Our trading model sees the Caterpillar Finance (CAT) secondary trading curve as an attractive short trading recommendation (-10 to -15bp) tighter to current levels.
AerCap (AER, Baa2/BBB+)
• AerCap 1Q revenue came in at $2.07 billion (+2% YoY), and net earnings rose 6.4%. However, “adjusted earnings” handily beat analysts' expectations. AerCap raised its “adjusted” outlook and used that raised outlook and the AER balance sheet to buy back stock in 1Q 2025.
• Financial Position: AerCap Holdings (AER) generates roughly $8 billion a year in revenue and has over $16 billion of net debt. While this is an excellent management team, there are very few corporate issuers nowadays that don’t use the debt markets to pay out shareholders. AerCap Holdings (AER) falls in that category.
• Model Trading Recommendation: Having recommended short sale of various AerCap bonds in the past, our credit trading model sees the AerCap Holdings (AER) secondary trading curve as overvalued and would see AER as an attractive short trading recommendation (-20bp) tighter.
Disclaimer - This report is not intended as, and does not constitute an offer, or a solicitation to buy or sell any securities or financial instruments. All data, levels, opinions, and representations herein are provided for informational purposes only and should not be relied upon for making investment decisions. Past performance is not indicative of future results. The authors of this report assume no liability for losses or damages arising from the use of this information. Investors should consult with a qualified financial advisor before making any investment decisions. The information in this report is based on sources believed to be reliable, but no guarantee is made as to its accuracy, completeness, or timeliness.