

By Larry Domash - contact gareth.moody@empirasign.com if you would like more information.
Good Morning Much has been written about Tuesday’s and today’s “unprecedented” FOMC meeting, with speculation on whether the US Federal Reserve will cut the overnight rate by 25 or 50 basis points. However, my focus is on two “bank shots” expected later today or over the next week.
First, US bank Net Interest Margin (NIM) estimates for Q4 2025 and 2026 are likely to be cut across the board. As seen with European banks, lower central bank borrowing rates are meant to be passed on to customers. However, a bank’s funding rate adjusts more slowly than the prevailing lending rate, squeezing NIM.
Second, ETF flows will be critical. I’m watching how much new money flowed into US equity, high-grade, and non-investment-grade corporate ETFs last week. These flows will significantly impact our credit trading model, which already reduced its long trading allocation to 67% from 70% overnight.
Tuesday’s USD risk trading was lively but lower across all risk markets. The trading model anticipates wider corporate bond spreads but not a “short-only” move.
Our model also displayed its top short trade indicator (Honeywell, see page 5). The US Single A Industrials sector has been volatile, swinging from short to overvalued and back to short in the past two months. Below is the full G-255 sector (issuer-by-issuer) breakdown.
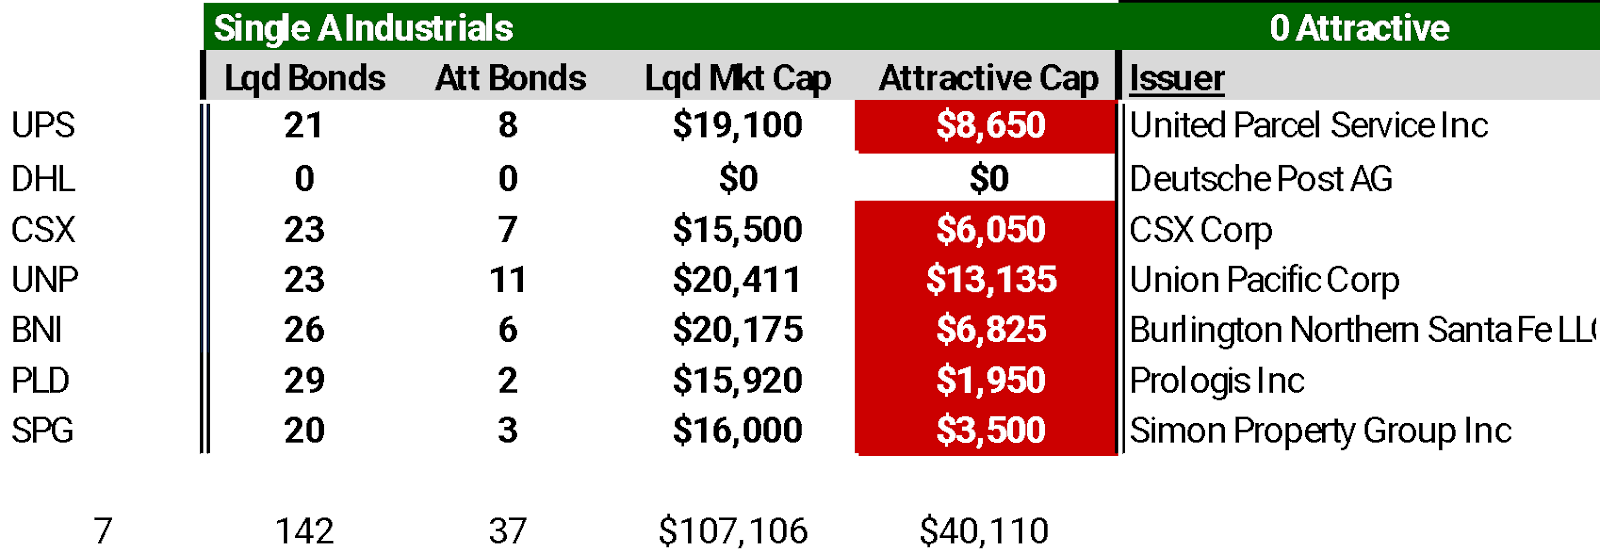
The Honeywell (A2/A) HON 4½ 01/15/34 is currently the most attractive short indicator among the 94 within the sector. Eleven of the 16 Single A-rated issuers are adding net debt to their balance sheets, and over $106 billion of the sector’s debt (104 bonds) is at extreme valuation.
I won’t offer “commentary,” but I’m puzzled why a sector so impacted to US tariffs and having the lowes cash flow growth of all 45 G – 255 trading sectors maintains such strong credit valuation. Similarly, I’m not critiquing Fed policy, but the dual mandate in Section 2A of the Federal Reserve Act of 1913 is clear. It seems the US Executive Branch may have overlooked it. Inflation isn’t declining, but employment is.
My role isn’t to opine but to identify the next trade indicator post the Fed’s announcement this afternoon. Have I really read the Federal Reserve Act of 1913? What do you think?
Trading Model Indicators and Strategy for Tuesday
Our systematic trading model indicates that USD high-yield (HY) and investment-grade (IG) credit are overvalued. Continued inflows into IG credit, combined with 45 sector indicators, will be measured later today. Post-Tuesday trading, 5-year credit is the most attractive maturity sector for the next 2 trading days.
Today's Systematic Trading Sector Indicators
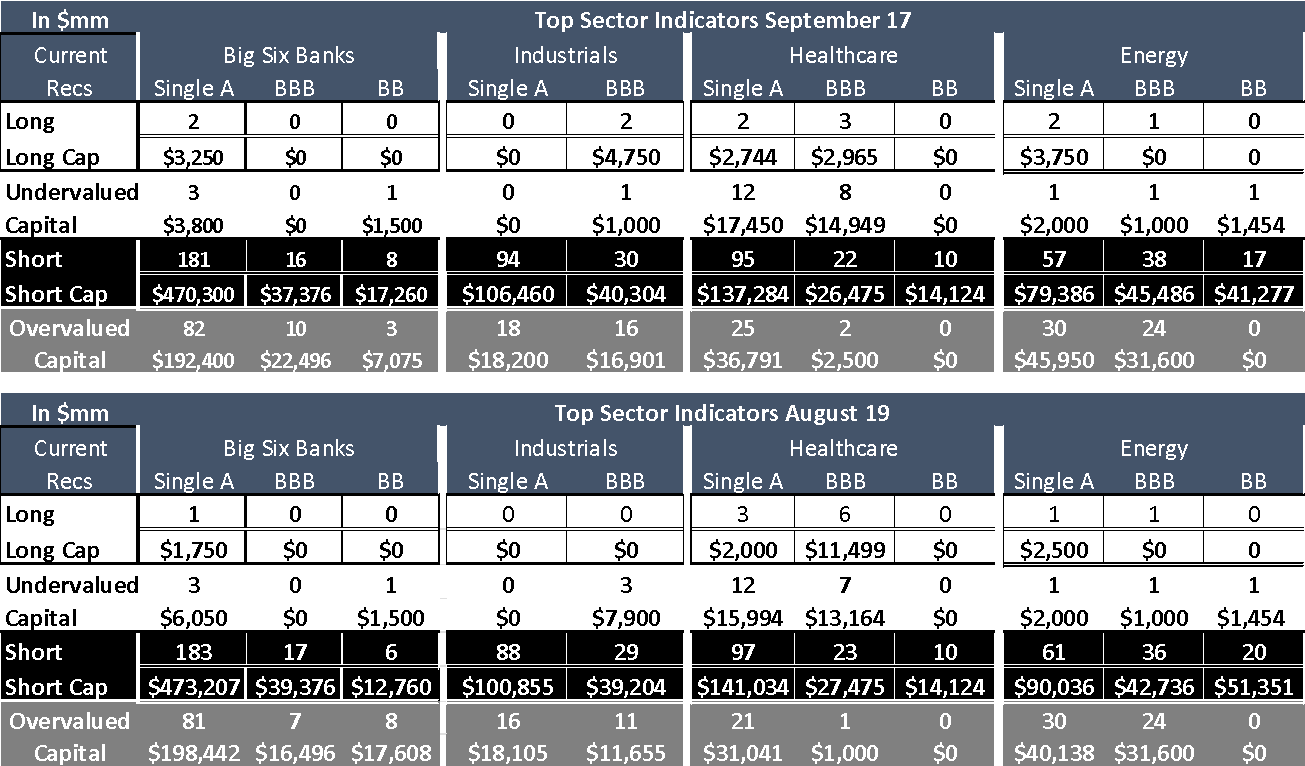
Top 3 Short-Indicated Sectors:
Big 6 Senior Bank Holdco (USD only)
USD Single A Healthcare (USD only)
Single A Industrials (all currencies)
Top 3 Long-Indicated Sectors:
US Regional Banks (USD)
US BBB/BB TMT (USD and EUR)
UK Banks (all currencies)
USD Systematic Trading Model
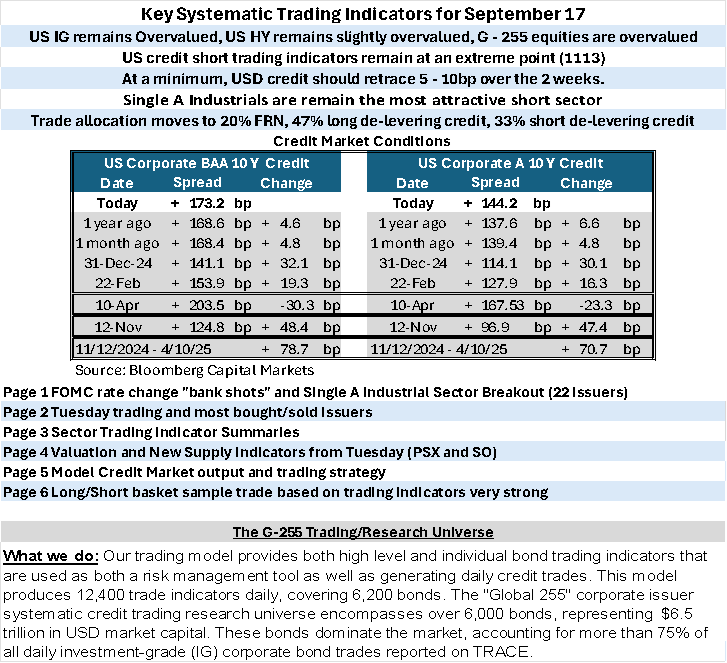
This morning’s model indicators suggest US credit overvalued with the most likely trading scenario wider over the next 5 – 10 trading days.
Trading Allocation Strategy
47% Long: Undervalued, deleveraging bonds.
33% Short: Overvalued bonds in re-leveraging sectors.
20% Front-End: 75% in floating-rate notes (<3 years).
Performance
Of 159 long/short trades in 2025 (marked via TRACE), 90% achieved ±5 bp targets, averaging ±7.33 bp per trade. Last week, US corporate bond ETFs and mutual funds saw smaller inflows for investment-grade bonds, while high-yield inflows flipped to positive.
Risk Management
The model avoids adding risk to G-255 issuers reporting within 30 days, as global regulatory requirements for reported material events could impact trading without notice.
US Economic Indicators / Inflation and Interest Rate Outlook
Retail sales rose 0.6% in August when compared to July.
July retail sales revised to +0.6% from +0.5%
Retail sales less autos rose 0.7% month over month in August.
Manufacturing output rose 0.2% in August with gains in categories including motor vehicles and parts, nonmetallic mineral products and textiles.
Tuesday’s U.S. Credit Trading
Investment-Grade (IG) Trading
Volume: 25% above average.
G-255 Issuers: 95 of the top 100 traded issuer bonds accounted for 92% of top 100 issuer volume and 71% of total TRACE volume.
High-Yield (HY) Trading
Volume: 13% above average.
G-255 Issuers: 14 of the top 25 traded bonds accounted for 64% of top 25 issuer volume and 65% of total TRACE volume.
Tuesday Credit Market Movement
U.S. CDX Index: +0.3 bp at 47.4 bp.
U.S. IG Cash Spreads: unchanged to (+2 bp) wider, with Utilities underperforming.
CDX HY Index: unchanged at 107.85 (per Bloomberg).
HY Cash Bonds: slightly wider, with BB TMT underperforming.
High-Yield Activity
• Dealers bought $900mm in HY bonds on Tuesday.
• Most Bought HY Bonds: Neptune Bidco (NLSN B2/B).
• Most Sold HY Bonds: Warner Media (WBD Ba2/BB, attractive long).
Investment Grade Activity
Dealers sold $150mm of IG bonds on Tuesday.
Most Bought Sector: Yankee Banks
UBS (UBS A2/A-, attractive short)
HSBC Holdings (HSBC, A1/A-, attractive long)
Most Sold Sector: BBB TMT
Intel (INTC Baa2/BBB, attractive short)
Broadcom (AVGO Baa1/BBB+ attractive long)
Attractive Trading Sectors
Long Opportunities
Focus on de-leveraging issuers, including Single A-rated global Autos, BBB-rated TMT, BBB-rated Energy, Euro Yankee Banks and Floating Rate Notes.
Valuation: The stochastic credit trading model identifies 156 undervalued bonds ($237.8 billion), with 61
long trade indicators across the 6,000-bond USD universe.
Short Opportunities
1,564 bonds ($2.41 trillion) are overvalued per the stochastic credit trading model, with 1131 short trade indicators.
U.S. Big 6 Banks (All Ratings): 300 bonds ($755 billion) overvalued, with 205 short indicators.
Single A and BB Energy: 107 bonds ($175.7 billion) overvalued, with 74 short indicators.
Single A Healthcare: 120 bonds ($174.6 billion) overvalued, with 95 short indicators.
Single A Industrials: 113 bonds ($125.8 billion) overvalued, with 97 short indicators.
G-255 Issuer News
Oracle + Tik Tok
TikTok's US operations are set to be acquired by a consortium comprising Oracle Corp., Andreessen Horowitz, and Silver Lake Management LLC. The agreement, pending discussions between President Donald Trump and Chinese President Xi Jinping, stipulates that Oracle will maintain its role as the cloud service provider for TikTok. Additionally, ByteDance, TikTok's parent company, will license the app's underlying technology to the consortium. The valuation for TikTok's US operations is estimated to be between $35 billion and $40 billion.
Oracle (ORCL Baa2/BBB) debt has an attractive short, equity has an attractive long indicator.
U.S. IG Credit Valuation and Spreads
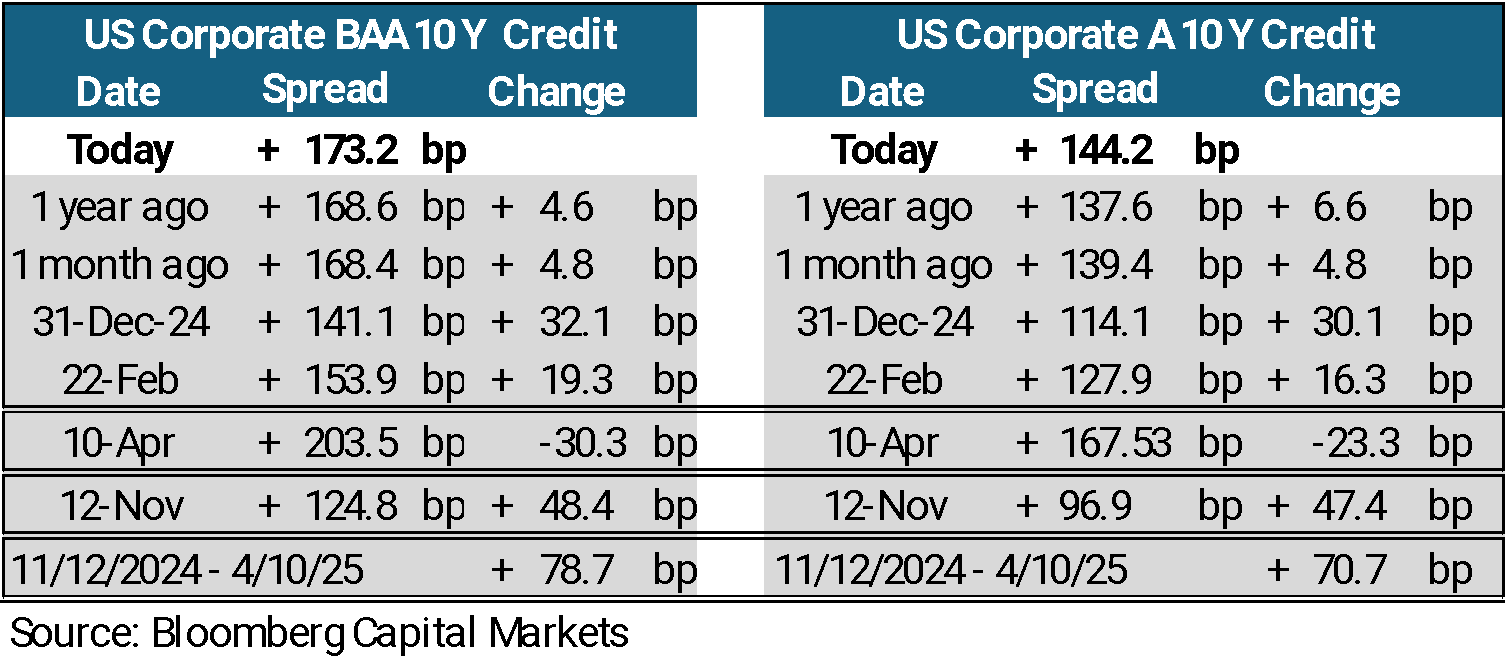
Credit Spread Recovery: U.S. credit spreads have recovered 34% of the widening observed from November 12, 2024, to April 10, 2025.
Credit Trading Model Valuation
The systematic credit trading indicator (Investment Grade and High Yield) is overvalued. A record 140 of the world’s 255 largest corporate debt issuers, the highest in the 34-year history of the trading model, are increasing leverage on their balance sheets.
2025 10-Year Credit Spreads
Year-over-Year (YoY): 10-year credit spreads are wider compared to last year.
Year-to-Date (YTD): Spreads are wider YTD.
UST 10-Year Rates: Up 42 basis points (bp) YoY but down -53 bp YTD.
Spread Widening: The Bloomberg/Moody’s 10Y index shows wider spreads due to new bond supply at elevated levels over the past 2 weeks, combined with a -20 bp decline in UST 10-year yields since September 1, 2025.
Global Equity Correlation to IG Credit Spreads
US equities correlated directionally with credit for a fifth day. As the S&P 500 fell slightly and US credit was as many as +2bp wider (IG and HY) on Tuesday. USD 10Y credit and equity prices have correlated 141 out of 188 trading days in 2025. This is well below normal over the past 33 years. While there is an 80% historic correlation between US equity prices and 10Y US corporate credit spreads, many of the recent geopolitical headlines and US currency fluctuation have led to a temporary de-coupling of the two risk markets.
New USD G-255 supply and fund flow data
2 more G – 255 issuers came to market on Tuesday. Phillips 66 (PSX) sold 30Y Junior Subordinated Bonds with both a 10Y and 5Y call. The bonds were some of the most aggressively priced new issue in the quarter, the trading model indicators were not attractive.
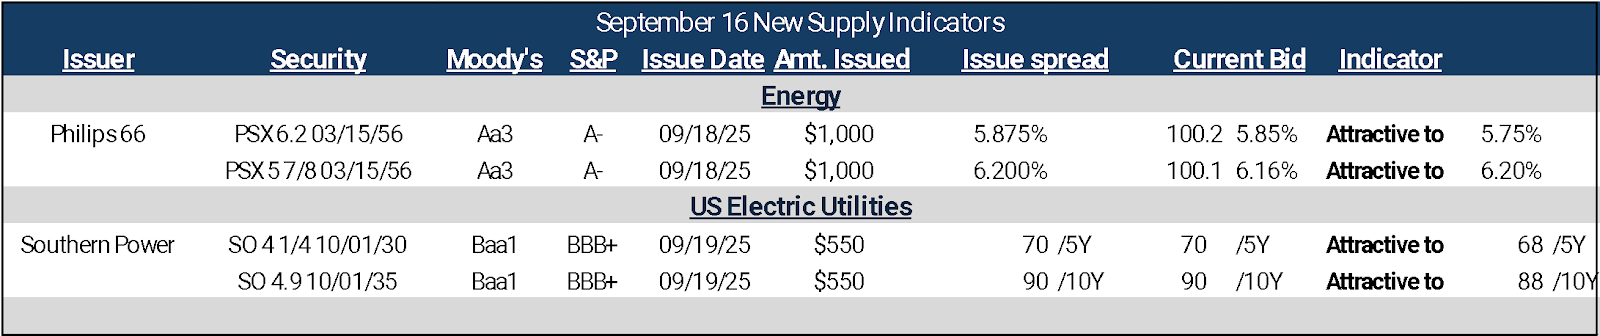
Southern Power Company (SO), the wholesale energy provider for Southern Company, made a rare offering. Southern Power is one of 3 US Utility operating divisions not re-levering it’s balance sheet as of June 30, 2025. Not surprising the company capped is offering @ $1.1 billion for the 5Y and 10Y and the transaction was well over – subscribed.
We expect a “moment of silence” from the USD new issue market as the US Federal Reserve Bank announces its September policy decision on Wednesday afternoon.
Systematic Trading Model Indicators and Strategy
Attractive Short Indicators: 1113, -16 from Tuesday +100% above the 200 day moving average of all model short trading recommendations.
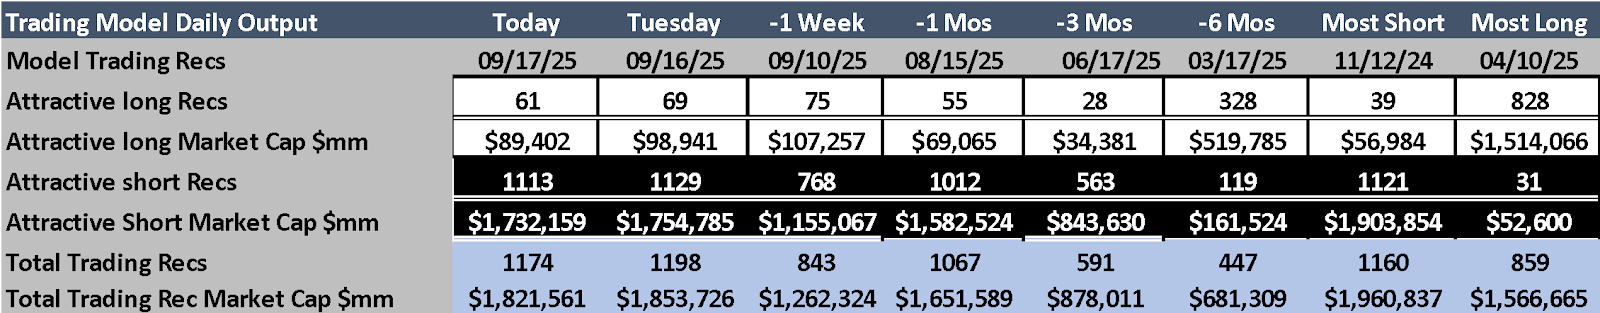
Attractive long indicators: 61, -8 from Tuesday.
Systematic Portfolio Trading Model Indicator:
Prioritize Long Positions: Focus on deleveraging new issues with attractive valuations, targeting 5-year maturities.
Short Positions: Target re-levering issuers trading at the deepest discount from their model avoid point. Avoid 7-year maturities due to low attractiveness.
Replace Longs: Replace long positions that have reached their avoid trading level.
Portfolio Trading Hurdle: Maintain a 1:1 long-to-short ratio once the 70% long position hurdle is reached.
Current Status of trading indicators below:
During the last week 5 long trades reached their avoid trading level and was replaced by 5 new issue trade indicators.
Systematic Credit Trading Strategy September 17, 2025
Closed Positions: Last week our trading model indicators showed 4 bonds that reached their avoid trading levels. On Monday 4 more new issue trades reached their reached their levels.
Enter New Longs: Last week the model added 5 new issue trades. Monday the model added the the RBC (Baa2/BBB) RY 6 ½ 11/24/2085 60nc10 as the next new supply indicator trade.
3. Enter New Short trades: The trading model indicators show adding short trades for each new long added (change from yesterday’s trading indicators).
4. Monitor Trade Position (Portfolio) Composition:
• Track the percentage of long positions relative to the total portfolio.
• If replacing the long positions that have reached their avoid trading level pushes the portfolio above the 70% long hurdle, initiate short positions in re-levering issuers (avoiding 7-year maturities) at a 1:1 ratio for any additional long positions.
5. Review: Reassess portfolio balance after today’s fund flow data to ensure alignment with the systematic
6. Tuesday’s Basket Trade long/ short ratio 64%
Systematic Credit Long/Short Basket Trade
The trading model uses predefined, back-tested processes driven by issuer data and market parameters, targeting ±5 basis points of spread movement in minimal trading days while minimizing volatility risk. The model employs only publicly available data.
Current Sample Systematic Basket bond trades based on trading strategy
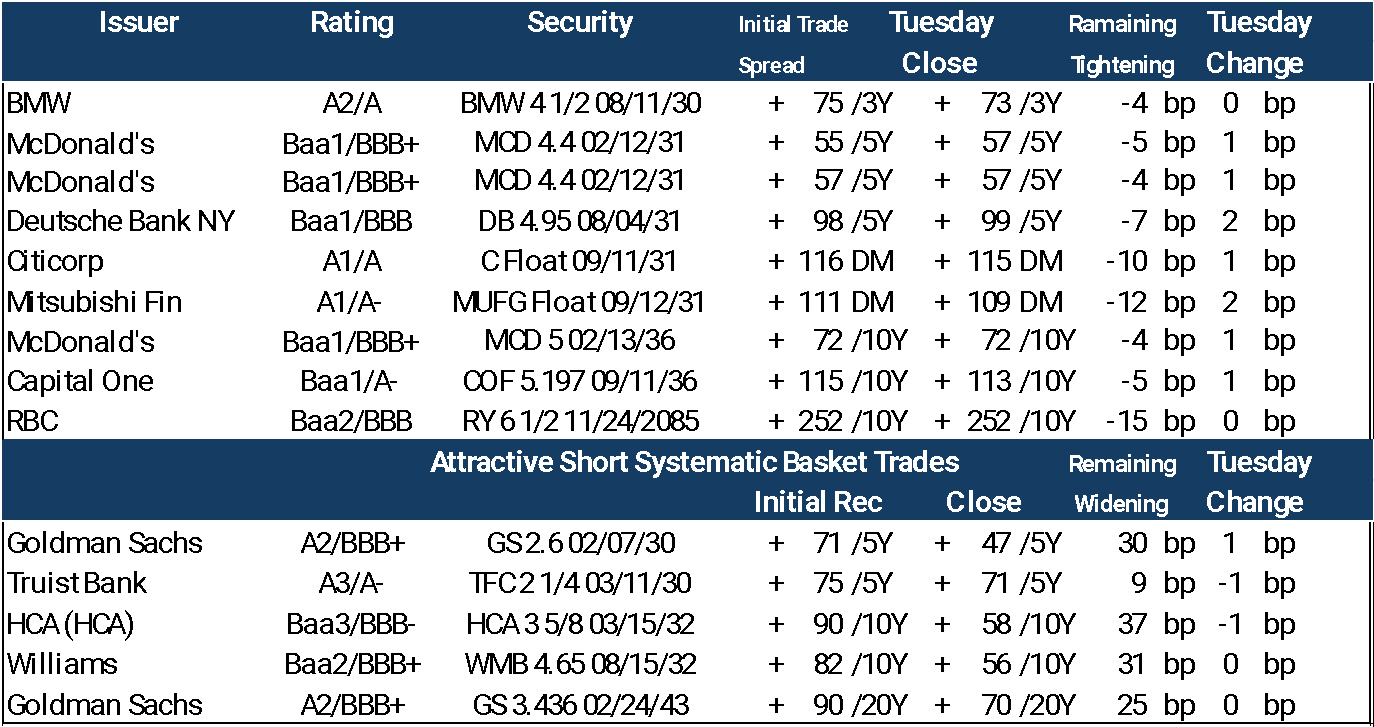
Wednesday Trading Indicators: Today the model adds the Honeywell (Honeywell (HON A2/A) HON 4 1/2 01/15/34 as the next short trade indicator
Systematic Long/Short Basket Trade Performance Report (January 4, 2025 – September 16, 2025)
Total Trades: 159 (1% of total trades).
Performance Summary:
Long Indicators: 119/127 reached avoid-trading levels, tightening by -9.33 bp.
Short Indicators: 27/32 reached avoid-trading levels, widening by +5.48 bp.
Remaining Longs: 9 tightened -1.3 bp.
Remaining Shorts: 5 tightened by -21.2 bp.
Average Spread Movement: ±7.22 bp in the recommended direction.
Success Rate: 91.5% of indicators reached avoid-trading levels, which is normal.
Average trade holding period: (19.77 trading days) below normal.
Disclaimer - This report is not intended as, and does not constitute an offer, or a solicitation to buy or sell any securities or financial instruments. All data, levels, opinions, and representations herein are provided for informational purposes only and should not be relied upon for making investment decisions. Past performance is not indicative of future results. The authors of this report assume no liability for losses or damages arising from the use of this information. Investors should consult with a qualified financial advisor before making any investment decisions. The information in this report is based on sources believed to be reliable, but no guarantee is made as to its accuracy, completeness, or timeliness.